 |
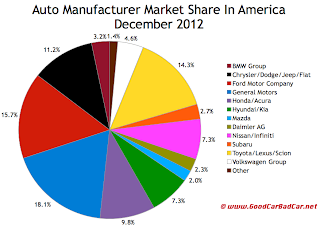
| Click Market Share Chart For Larger View |
While updating this December 2012 post, which includes year end numbers, GoodCarBadCar.net also posted to this 2012 Year End U.S. Auto Sales Brand Rankings post. Yes, the numbers are the same, but brands will be ranked by 2012 twelve-month totals, not by December figures as they are here.
As always, you'll find model-by-model totals by selecting a make or model at GCBC's Sales Stats home. Yearly figures go back a decade; monthly data stretches back to 2010. GCBC will soon publish December and 2012 best seller lists for cars, trucks, and SUVs.
Updated at 4:45 PM AT on 01.03.2013
Rank | Automaker | December 2012 | % Change | Year To Date | YTD % Change |
#1 | Ford | 205,518 | + 2.2% | 2,160,859 | + 5.0% |
#2 | Chevrolet | 167,091 | + 3.7% | 1,851,646 | + 3.0% |
#3 | Toyota | 158,014 | + 6.3% | 1,764,833 | + 26.3% |
#4 | Honda | 116,740 | + 26.8% | 1,266,569 | + 23.7% |
#5 | Nissan | 86,663 | - 3.6% | 1,021,779 | + 8.2% |
#6 | Hyundai | 59,435 | + 17.1% | 703,007 | + 8.9% |
#7 | Dodge | 52,391 | + 26.1% | 524,989 | + 16.4% |
#8 | Volkswagen | 44,005 | + 35.4% | 438,133 | + 35.1% |
#9 | GMC | 43,921 | + 4.7% | 413,881 | + 4.0% |
#10 | Jeep | 39,871 | - 8.5% | 474,131 | + 13.1% |
#11 | Kia | 39,178 | - 9.7% | 557,599 | + 14.9% |
#12 | BMW | 37,399 | + 39.4% | 281,460 | + 13.5% |
#13 | Subaru | 36,653 | + 8.8% | 336,441 | + 26.0% |
#14 | Ram | 30,885 | + 16.1% | 300,928 | + 39.1% |
#15 | Lexus | 30,607 | + 20.7% | 244,166 | + 23.0% |
#16 | Mercedes-Benz | 30,376 | + 11.3% | 295,063 | + 12.7% |
#17 | Mazda | 27,251 | + 21.9% | 277,046 | + 10.6% |
#18 | Chrysler | 25,513 | + 6.4% | 307,967 | + 16.8% |
#19 | Cadillac | 18,248 | + 12.2% | 149,782 | - 1.7% |
#20 | Buick | 16,473 | + 10.0% | 180,408 | + 1.6% |
#21 | Acura | 16,034 | + 22.1% | 156,216 | + 26.7% |
#22 | Audi | 14,841 | + 17.3% | 139,310 | + 18.5% |
#23 | Infiniti | 12,627 | + 14.9% | 119,877 | + 21.8% |
#24 | Lincoln | 7384 | - 12.1% | 82,150 | - 4.1% |
#25 | Mini | 6456 | + 13.0% | 66,123 | + 15.0% |
#26 | Volvo | 6150 | + 15.1% | 68,117 | + 1.3% |
#27 | Scion | 5522 | + 32.8% | 73,505 | + 49.2% |
#28 | Land Rover | 5174 | + 9.1% | 43,664 | + 14.6% |
#29 | Mitsubishi | 4113 | - 18.3% | 57,790 | - 26.9% |
#30 | Fiat | 3707 | + 59.4% | 43,772 | + 121% |
#31 | Porsche | 2952 | + 61.0% | 35,043 | + 20.7% |
#32 | Suzuki | 1945 | - 24.2% | 25,357 | - 4.7% |
#33 | Jaguar | 1049 | - 7.7% | 12,011 | - 2.2% |
#34 | smart | 996 | + 40.3% | 10,009 | + 68.9% |
#35 | Maserati | 333 | + 39.9% | 2730 | + 17.6% |
#36 | Bentley | 237 | - 25.2% | 2315 | + 23.3% |
--- | ----- | ----- | ----- | ----- | ----- |
245,733 | + 4.9% | 2,595,717 | + 3.7% | ||
212,902 | + 1.6% | 2,243,009 | + 4.7% | ||
194,143 | + 13.2% | 2,082,504 | + 26.6% | ||
152,367 | + 10.4% | 1,651,787 | + 20.6% | ||
132,774 | + 26.2% | 1,422,785 | + 24.0% | ||
99,290 | - 1.6% | 1,141,656 | + 9.5% | ||
98,613 | + 4.7% | 1,260,606 | + 11.4% | ||
62,035 | + 31.1% | 614,801 | + 30.0% | ||
43,855 | + 34.8% | 347,583 | + 13.8% | ||
31,372 | + 12.0% | 305,072 | + 14.3% | ||
6223 | + 5.8% | 55,675 | + 10.5% | ||
--- | ----- | ----- | ----- | ----- | ----- |
--- | Total | 1,356,070 | + 9.0% | 14,492,398 | + 13.4% |
Related From GoodCarBadCar.net
2012 Year End U.S. Auto Sales Brand Rankings
U.S. Auto Sales Brand Rankings - January 2013
U.S. Auto Sales Brand Rankings - November 2012
U.S. Auto Sales Brand Rankings - October 2012
U.S. Auto Sales Brand Rankings - December 2011
Top 30 Best-Selling Vehicles In America - December 2012
No comments:
Post a Comment