December 2012 & 2012 Year End Small, Midsize, And Large Car Sales In America
Browse »
Home »
2012 Sales
,
Compact Car Sales
,
December 2012
,
Graph
,
Large Car Sales
,
Midsize Car Sales
,
Sales Stats
,
US 2012 Sales
,
US Auto Sales
,
US Compact Car Sales
,
US December 2012
,
US Large Car Sales
,
US Midsize Car Sales
» December 2012 & 2012 Year End Small, Midsize, And Large Car Sales In America
 |
2012 Small Car Sales Chart
Click Any Chart For Larger View |
America's best-selling small car in 2012 was also the best-selling car overall in December 2012 and the fifth-ranked automobile out of the 266 different nameplates which were sold last year. Honda Civic sales jumped 44% in 2012 from a dreadful low in 2011. The Civic's chief rivals, in volume terms, were the Toyota Corolla (and its Matrix hatchback sibling), the Ford Focus, Chevrolet's Cruze, and the Hyundai Elantra. No other small car found more than 200,000 new owners in the twelve months of 2012. |
| December 2012 Small Car Sales Chart |
Looking at December alone, the rankings were perfectly aligned with the year end results. Poor year-over-year results were reported by some of the least expensive small cars in the United States. Honda Fit sales fell 28%, the Hyundai Accent plunged 45%, Kia Soul sales dropped 25%, and sales of the Toyota Yaris slid 56%. On the flip side, the Fiat 500, Ford Fiesta, Kia Rio, Mazda 2, Nissan Versa, and smart fortwo all posted measurable gains in December. |
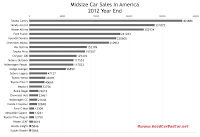
| 2012 Midsize Car Sales Chart |
Moving up a category in size and/or price, America's third-best-selling vehicle was also the best-selling midsize car and best-selling car overall in 2012. Toyota Camry sales jumped 31% last year, topping 400,000 units for the first time since 2008. The Camry beat its nearest rival, Honda's Accord, by 73,014 sales. Even if you include the Crosstour in the Accord's total, as it once was, the Camry still ended 2012 52,166 sales in front. Disappointing 2012 finishes were posted by the Buick Regal, down 39% in 2012 and the Volkswagen CC, down 27%. Other midsize sedans which posted declines were either in replacement mode or defunct. |
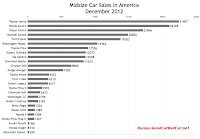
| December 2012 Midsize Car Sales Chart |
December midsize car results still had the Camry on top, but its lead over the Honda Accord was just 1979 units. The Camry beat the Accord by 15,839 sales in December 2011. American brand midsize cars took a hit in December, as the Buick Regal, Chevrolet Malibu, Chrysler 200, and Ford Fusion all recorded declining year-over-year volume. Together, the Hyundai Sonata and Kia Optima outsold all other individual models, including the Camry, something which didn't occur in the 2012 calendar year. |
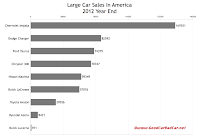
| 2012 Large Car Sales Chart |
You can also find detailed December 2012 and 2012 year end sales figures for large cars near the bottom of this post. The Hyundai Azera certainly posted some of the most momentous year-over-year improvements, but that's mainly because it was rising from the ashes. The Azera remains a truly rare car. Toyota, however, finally got the Avalon kickstarted in December, posting a 60% increase compared with December 2011. Last month's 5171 Avalon sales total accounted for 18% of the nameplate's year end total. |
| December 2012 Large Car Sales Chart |
As always, you can find historical monthly and yearly sales figures for any of these models by selecting a make and model at GCBC's Sales Stats home or just clicking their name in the tables below. The biggest change from last month's edition of this post is that the tables visible after the jump are now sortable. Click any heading to see the cars listed by December volume, or year-over-year change, or whatever you like. Click the heading again to flip the order, and click the headings at the far left to return to the original order. Small Car | December 2012 | %
Change | 2012 Year End | YTD
% Change |
| 4820 | + 1747% | 41,042 | + 15,388% |
| 21,230 | + 27.3% | 237,758 | + 2.6% |
| ----- | - 100% | 21 | - 99.9% |
| 5993 | + 3.9% | 81,314 | + 83.2% |
| 2229 | ----- | 12,385 | ----- |
| 31 | - 97.8% | 10,176 | - 71.0% |
| 6105 | ---- | 25,303 | ----- |
| 3707 | + 59.4% | 43,772 | + 121% |
| 5612 | + 52.8% | 56,775 | - 17.2% |
| 22,604 | + 58.3% | 245,922 | + 40.0% |
| 33,118 | + 61.2% | 317,909 | + 43.7% |
| 3680 | - 28.4% | 49,346 | - 16.7% |
| 2933 | - 44.8% | 61,004 | + 9.7% |
| 19,024 | + 46.1% | 202,034 | + 8.4% |
| 1976 | - 9.7% | 34,862 | + 276% |
| 4276 | - 9.6% | 75,681 | - 0.8% |
| 2343 | + 8.7% | 40,275 | + 100% |
| 7177 | - 25.4% | 115,778 | + 13.2% |
| 2967 | + 121% | 19,315 | + 38.4% |
| 10,297 | + 11.2% | 123,361 | + 20.4% |
| 4232 | + 13.5% | 45,111 | + 10.5% |
| 77 | + 1.3% | 588 | + 635% |
| 1301 | - 16.0% | 16,426 | - 17.3% |
| 589 | + 45.1% | 7667 | - 47.0% |
| 7755 | - 11.0% | 106,395 | - 7.5% |
| 10,618 | + 6.8% | 113,327 | + 13.6% |
| 576 | + 132% | 8879 | + 3480% |
| 1391 | - 3.7% | 19,787 | + 16.3% |
| 677 | - 23.1% | 10,756 | + 12.4% |
| 996 | + 40.3% | 10,009 | + 92.2% |
| 7505 | + 11.7% | 81,799 | + 98.6% |
| 3409 | ----- | 7396 | ----- |
| 1051 | - 21.0% | 12,860 | + 2.75 |
| 24,679 | + 17.5% | 290,947 | + 21.1% |
| 3151 | ----- | 35,733 | ----- |
| 1999 | - 55.7% | 30,590 | - 6.5% |
| 3182 | + 108% | 29,174 | + 351% |
| 2854 | + 4.0% | 40,885 | + 17.8% |
| 15,661 | + 8.6% | 170,424 | - 3.9% |
Midsize Car | December 2012 | %
Change | 2012 Year End | YTD
% Change |
| 1526 | - 50.6% | 24,616 | - 38.7% |
| 11,630 | - 10.8% | 210,951 | + 3.0% |
| 2633 | + 72.2% | 23,461 | + 206% |
| 9080 | - 1.4% | 125,476 | + 40.3% |
| 7382 | + 18.8% | 96,890 | + 51.3% |
| 4310 | ----- | 13,309 | ----- |
| 19,283 | - 10.8% | 241,263 | - 2.7% |
| 29,428 | + 66.6% | 331,872 | + 40.8% |
| 2183 | + 68.6% | 20,848 | + 16.0% |
| 310 | - 55.1% | 5846 | - 62.4% |
| 20,826 | + 20.1% | 230,605 | + 2.1% |
| 12,008 | + 12.2% | 152,399 | + 80.2% |
| 1384 | - 54.9% | 33,756 | - 5.5% |
| 299 | - 50.1% | 13,261 | - 15.2% |
| 23,966 | - 7.7% | 302,934 | + 12.6% |
| 1489 | + 56.1% | 9819 | + 1.5% |
| 4217 | - 8.8% | 47,127 | + 11.1% |
| 12,072 | - 10.1% | 117,553 | + 12.6% |
| 362 | - 39.4% | 5566 | - 19.8% |
| 31,407 | - 6.3% | 404,886 | + 31.2% |
| 20,040 | + 17.9% | 236,659 | + 73.4% |
| 12,536 | n/a | 147,507 | + 15.2% |
| 2992 | n/a | 40,669 | + 384% |
| 3151 | ----- | 35,733 | ----- |
| 1361 | ----- | 12,750 | ----- |
| 4423 | + 41.0% | 43,095 | + 10.8% |
| 14,462 | + 110% | 117,023 | + 412% |
| 2196 | - 10.4% | 21,646 | - 26.6% |
Large Car | December 2012 | %
Change | 2012 Year End | YTD
% Change |
| 4074 | - 24.0% | 57,076 | - 2.4% |
| 1 | - 99.9% | 971 | - 95.2% |
| 9641 | - 8.0% | 169,351 | - 1.2% |
| 7175 | + 39.5% | 70,747 | + 95.0% |
| 7867 | + 9.1% | 82,592 | + 17.8% |
| 6904 | + 22.2% | 74,375 | + 17.1% |
| 847 | + 4606% | 8431 | + 453% |
| 4137 | - 18.4% | 59,349 | + 1.0% |
| 5171 | + 60.1% | 29,556 | + 2.2% |
Related From GoodCarBadCar.net


No comments:
Post a Comment