Showing posts with label US Van Sales. Show all posts
Thursday, March 7, 2013

February 2013 Commercial Van Sales In America

February 2013 U.S. commercial van sales chart
Click Chart For Larger View
21,354 commercial vans were sold in the United States in February 2012. Declines were reported by the best-selling Ford E-Series and the slower sellers at General Motors and Chrysler.

Overall, the segment was worth 1.8% of the new vehicle market's volume and through first two months of 2013, that figure stands at... 1.8%.  

Fuly 58% of the commercial vans sold in the United States this year have been Fords. You can find historical monthly and yearly sales figures for any of the seven vans by clicking the model name below or by making a selection at GCBC's Sales Stats page.


Click Column Headers To Sort - January 2013 Edition
Van
February 
2013
%
Change
Year 
To 
Date
YTD
% Change
5504
+ 4.7% 9466 - 3.3%
8336
- 17.5% 16,323 - 3.3%
3610
+ 56.6% 6771 + 51.9%
886
- 58.3% 1930 - 34.9%
1228
+ 48.0% 2305 + 31.4%
1252
+ 55.1% 1995 + 27.6%
538
- 1.8% 1051 + 10.2%
Source: Manufacturers

RECOMMENDED READING
Commercial Van Sales In America - January 2013
U.S. Auto Sales Brand Rankings - February 2013
Top 14 Best-Selling Pickup Trucks In America - February 2013
Minivan Sales In America - February 2013
Wednesday, February 6, 2013

January 2013 Commercial Van Sales In America

January 2013 U.S. commercial van sales chart
Click Chart For Larger View
Commercial van sales in America rose 12.4% in January 2013. With just over 18,000 sales, the seven vans listed in the table below and in the accompanying chart accounted for 1.8% of the overall market.

Ford's E-Series was responsible for 43% of the sector. Including the Transit Connect, Ford grabbed 60% of the sector. The E-Series outsold all non-Ford vans combined.


You can click the model name of any of these vehicles to find historical monthly and yearly sales figures. The accompanying chart can be clicked for a larger view - it ranks the vans by January volume. You can do the same by sorting the table below. Click any column header to switch the order around.

Van
January 2013
%
Change
Year 
To Date
YTD
% Change
3962
- 12.6%3962- 12.6%
7987
+ 17.7% 7987 + 17.7%
3161
+ 46.8% 3161 + 46.8%
1044
+ 24.6% 1044 + 24.6%
1077
+ 16.6% 1077 + 16.6%
743
- 1.7% -743 - 1.7%
513
+ 26.4% 513 + 26.4%
Source: Manufacturers & ANDC

Related From GoodCarBadCar.net
Commercial Van Sales In America - February 2013
Commercial Van Sales In America - December & 2012 Year End
Minivan Sales In America - January 2013
Pickup Truck Sales In America - January 2013
U.S. Auto Sales Brand Rankings - January 2013
Tuesday, January 8, 2013

December 2012 And 2012 Year End Commercial Van Sales In America

2013 Nissan NV200 red brick
Nissan's Next New Commercial Van, The NV200
2012 U.S. commercial van sales chart
2012 Commercial Van Sales Chart
In spite of an 8% decline in December, the Ford E-Series continued as America's best-selling commercial van in 2012. The category will change significantly as 2013 progresses - the biggest Ford van will itself change significantly in 2013.

In the twelve months of 2012, every commercial-oriented van on sale in America sold more frequently than in 2011. That wasn't such a surprise in the case of Nissan's NV and Ram's Cargo Van, neither of which was on sale for the duration of 2011. But the Mercedes-Benz Sprinter and GMC Savana both generated improvements better than the auto industry's 13.4% increase.


December 2012 U.S. commercial van sales chart
December 2012
Commercial Van Sales Chart
December 2012 was the the best U.S. sales month yet for the Nissan NV, slightly better than what Nissan USA managed in December of last year and March of this year.

As always, you can find historical monthly and yearly sales figures for any of these models by selecting a make and model at GCBC's Sales Stats home or just clicking their name in the tables below. The biggest change from last month's edition of this post is that the table visible below is now sortable. Click any heading to see vans listed by December volume, or year-over-year change, or whatever you like. Click the heading again to flip the order, and click the headings at the far left to return to the original order.

Van
December 2012
%
Change
2012
Year
End
YTD
% Change
7387
- 12.7% 76,808 + 6.8%
11,999
- 8.2% 122,423 + 4.7%
3776
- 3.4% 35,216 + 10.3%
1330
- 47.4% 20,650 + 19.6%
2231
+ 39.9% 20,929 + 26.3%
1250
+ 1.6% 10,179 + 58.0%
674
+ 287% 7075 + 922%
Source: Manufacturers & ANDC

Related From GoodCarBadCar.net
Commercial Van Sales In America - January 2013
Commercial Van Sales In America - November 2012
Commercial Van Sales In America - October 2012
U.S. Auto Sales Brand Rankings - December & 2012 Year End
Saturday, December 15, 2012

November 2012 Commercial Van Sales In America

2013 Fiat Ducato Cargo area
U.S. sales of the Ram Cargo Van were significantly higher in November 2012 than in November 2011, but it remains an unlikely purchase for the vast majority of commercial van buyers. Of the 21,683 vans registered in November 2012 by electricians, water purification installers, and regular people who need space for a dozen kids, only 3.4% were Ram Cargo Vans.

The new Fiat Ducato-based Ram ProMaster will likely do big things for the brand's share of the category, however. Announced late last month, the ProMaster should be quite a bit different from the Ducato, Ram says. But the cargo hold you see in the above image will presumably go unaltered.


U.S. November 2012 commercial van sales chart
We can expect to see the Euro-derived, E-Series-replacing Ford Transit continue in its place atop the leaderboard. Its margin of victory at the end of each and every month may not be so significant when Ram provides its challenger.

As always, you can click any model name in the tables visible after the jump to see historical monthly and yearly sales figures. Or you can select any make or model at GCBC's Sales Stats home. Any van you can't find tabled here will be listed elsewhere - you can select from segments like minivans and pickup trucks at GCBC's The Tally page.

Click any the accompanying chart for a larger view. In that chart, vans are ranked by volume - they're listed alphabetically in the tables below.

Van
November 2012
%
Change
Year To Date
YTD
% Change
6007
+ 11.5% 69,421 + 9.4%
8400
+ 7.8% 110,424 + 6.4%
2853
+ 5.0% 31,440 + 12.3%
1014
+ 38.5% 19,320 + 31.1%
1630
+ 56.0% 18,698 + 24.8%
1042
- 15.8% 8929 + 71.3%
737
+ 226% 6401 + 1136%
Source: Manufacturers & ANDC

Related From GoodCarBadCar.net
Commercial Van Sales In America - December & 2012 Year End
Commercial Van Sales In America - October 2012
Commercial Van Sales In America - September 2012
U.S. Auto Sales Brand Rankings - November 2012
Minivan Sales In America - November 2012
Friday, November 9, 2012

October 2012 U.S. Commercial Van Sales

U.S. commercial van sales chart October 2012
Click Chart For Larger View
Fewer than four out of every 100 new commercial vans registered in America in October 2012 were Ram Cargo Vans. The weak-selling Nissan NV didn't measure up to its own October 2011 performance, falling 18% year-over-year. Mercedes-Benz's Sprinter owned 8.3% of the market. 

That leaves the major players, Ford and General Motors. The Chevy Express and GMC Savana combined to grab just under one-third of the segment. That left Ford with 54.4% of all new commercial van segment. 25% of Ford's total was Transit Connect-derived.


As will always be the case in the future, historic brand and corporate totals (monthly and yearly going back to 2002) are now available through the dropdown menu at GCBC's Sales Stats page, along with results for more than 260 currently sold vehicles. Or you could just click the model name in the table below.

Van
October 2012
%
Change
Year To Date
YTD
% Change
5528
- 13.9% 63,414 + 9.2%
8082
+ 18.7% 102,024 + 6.3%
2669
+ 22.4% 28,587 + 13.1%
1047
+ 15.1% 18,306 + 30.7%
1666
+ 12.2% 17,068 + 22.5%
770
- 18.2% 7887 + 98.4%
385
+ 145% 5664 + 1840%
Source: Manufacturers & ANDC

Related From GoodCarBadCar.net
Commercial Van Sales In America - November 2012
Commercial Van Sales In America - September 2012
Commercial Van Sales In America - August 2012
U.S. Auto Sales Brand Rankings - October 2012
Truck Sales And Minivan Sales In America - October 2012
Wednesday, October 17, 2012

September 2012 Commercial Van Sales In America

U.S. September 2012 commercial van sales chart
Click Van Sales Chart For A Larger View
60% of the 19,876 commercial vans sold in the United States in September 2012 were Fords. Of FoMoCo's 11,965 E-Series/Transit Connect sales, 75% were of the larger E-Series variety.

General Motors' two vans combined to hold 25% market share, down from 34% in August. Mercedes-Benz, Nissan, and Chrysler - via the Ram Cargo Van - accounted for 15% of the commercial/cargo/personnel carrier vans sold in America last month.

In total, these seven vans were responsible for 1.7% of the overall new vehicle market. That's down from 1.9% in August and down from 2.1% in September of last year. Blame the Chevrolet Express. Year-over-year volume slid 49%, or 3675 units.


Historical monthly and yearly sales results for 282 different vehicles can be accessed through the first dropdown menu at GCBC's Sales Stats home or, for non-mobile users, near the top right of this page. Click any model from the tables below to go directly to its own specific sales results page. You can also click the accompanying chart to see vans ranked by September 2012 volume.

Van
September 2012
%
Change
Year To Date
YTD
% Change
3881
- 48.6% 57,886 + 12.0%
8952
+ 2.8% 93,942 + 5.3%
3013
+ 15.4% 25,918 + 12.2%
1005
+ 18.8% 17,259 + 31.8%
1794
+ 0.8% 15,402 + 23.7%
798
+ 31.5% 7117 + 134%
433
+ 223% 5279 + 3810%
Source: Manufacturers & ANDC

Related From GoodCarBadCar.net
Commercial Van Sales In America - October 2012
Commercial Van Sales In America - August 2012
Commercial Van Sales In America - July 2012
U.S. Auto Sales Brand Rankings - September 2012
Tuesday, September 18, 2012

August 2012 Commercial Van Sales In America

2013 Ford Transit Custom Blue
Ford's Next Transit Is Perfect For Installing Solar
Panels On The Roof Of A Spectacular Chalet
24,641 cargo vans - some of which were inevitably turned into RVs or airport hotel passenger transporters - were sold to American buyers in August 2012. 

Through eight months, sales of these seven vans have risen 19.1%. 

Together they've accounted for 2.1% of the America's overall new vehicle market in 2012, a market which has grown 14.7% year-over-year. In the first eight months of 2011 these vans were responsible for 2.0% of America's new vehicle market.

As the accompanying chart makes very clear, the Ford E-Series vans are America's favourites, although their share of the market is in decline. At this time last year, the Ford E-Series (not to be confused with the Mercedes-Benz E-Class) accounted for 47.2% of the commercial vans sold in the United States. That number has fallen to 41.9% in 2012. 

August 2012 U.S. cargo van sales chart
Commercial Van Sales Chart
Click Chart For Larger View
FoMoCo doesn't want this trend to continue, so the Blue Oval is about to start operating with Mercedes-Benz-like tendencies. Instead of offering a cargo van with an antiquated chassis to American customers, Ford will soon begin selling Europe's full-size Transit on this side of the Atlantic. The new version is pictured above. It's Sprinteresque.

As always, historical monthly and yearly sales figures for all these vans can be found by selecting a vehicle through the first dropdown menu at GCBC's Sales Stats home. There's way more data that can be accessed that way than you can possibly have interest in. You could also just click the model name below for monthly sales which go back as far as January 2010 and yearly sales which stretch back to 2002.

Van
August 2012
%
Change
Year To Date
YTD
% Change
6861
+ 17.9% 54,005 + 22.4%
9151
+ 0.1% 84,990 + 5.6%
3324
+ 21.6% 22,905 + 11.8%
1545
+ 72.6% 16,254 + 32.7%
2129
+ 15.3% 13,608 + 27.5%
783
+ 19.4% 6319 + 160%
848
+ 84,700% 4846 + 484,500%
Source: Manufacturers & ANDC

Related From GoodCarBadCar.net
Commercial Van Sales In America - September 2012
U.S. Commercial Van Sales - July 2012
All 262 Vehicles Ranked By August 2012 YTD Sales
U.S. Auto Sales By Brand - August 2012
Minivan & Truck Sales In America - August 2012
Sunday, August 19, 2012

July 2012 Commercial Van Sales In America

While it may not seem important to casual auto industry observers who simply wish to find out which Japanese sedan was America's best-selling car in July 2012, commercial vans form a key part of an automaker's plans in the United States. Well, some automakers.
2011 Ford Transit Connect Taxi
Ford, for example, scored 6.7% of its total July volume with the E-Series and Transit Connect. With 11,201 sales between the two, these cargo (and sometimes personal use) vans were more important, on volume terms, than the Mustang, Taurus, Fiesta, Edge, Expedition, or Flex.

At General Motors, the Chevy Express and GMC Savana combined for 11,980 sales in July 2012. Combined, Chevrolet's Tahoe and Suburban didn't come up with that kind of volume.


U.S. July 2012 cargo van sales chart
Commercial Van Sales Chart
Click For A Larger View
Over at Mercedes-Benz, the Sprinter was delivered to 473 more new owners than the CL, S, SL, SLK, SLS, G, and R-Classes put together. You can argue that the Sprinter doesn't make quite as much money for Mercedes-Benz as, perhaps, an S63 AMG, but with 2.6 times the volume and a simple chassis, Mercedes-Benz is probably quite thankful to have the Sprinter on its side.

Historical monthly and yearly sales figures for all these vans can be accessed through the first dropdown menu at GCBC's Sales Stats home or near the top right of this page. Below you'll find detailed July and year-to-date data.

Van
July 2012
%
Change
Year To Date
YTD
% Change
Chevrolet Express
9327
+ 74.6% 47,144 + 23.1%
Ford E-Series
8574
- 2.6% 75,839 + 6.3%
Ford Transit Connect
2627
+ 0.8% 19,581 + 10.2%
GMC Savana
2653
+ 118% 14,709 + 29.5%
Mercedes-Benz Sprinter
2203
+ 27.2% 11,479 + 30.0%
Nissan NV
651
- 4.1% 5536 + 212%
Ram Cargo Van
555
----- 3998 -----
Source: Manufacturers & ANDC

Related From GoodCarBadCar.net
Commercial Van Sales In America - August 2012
Commercial Van Sales In America - June 2012
Commercial Van Sales In America - May 2012
Minivan Sales In America - July 2012
U.S. Auto Sales By Brand - July 2012 Rankings
Thursday, July 12, 2012

June 2012 Commercial Van Sales In America

2014 Nissan NV200 Taxi
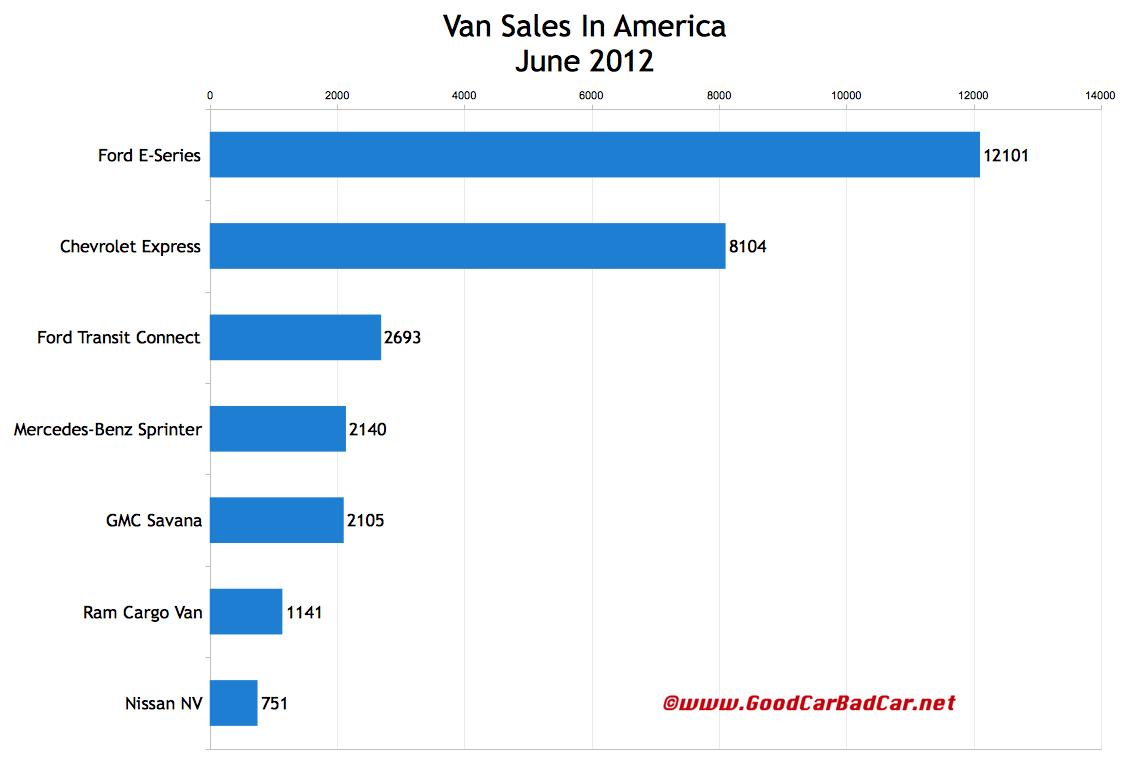
29,035 new full-size and/or cargo vans were registered in the United States in June 2012. 51% of those registration papers have "Ford" in the section marked for make. 82% of those Fords were E-Series/Econolines, not the third-ranked Transit Connects.

U.S. June 2012 cargo van sales chart
June 2012 Commercial Van Sales Chart
Click Chart For A Larger View
There's not a whole lot of interesting stuff to be said about the commercial van segment. Yes, some of these vans might be kitted out with a dozen seats for airports or massive families. But most go to tradespersons and delivery companies, ending up as the 8-5 transportation for people who have another vehicle at home for evening trips into the city. 

And that other vehicle they have in the driveway? It may well be one of the 30 best-selling vehicles in America. You can check out historical monthly and yearly sales figures for all seven of these vans by using the dropdown menu at the top right of this page or at GCBC's Sales Stats home. Just pull up the manufacturer you desire and the model box will fill with all models currently sold by that company.

Van
June 2012
%
Change
Year To Date
YTD
% Change
Chevrolet Express
8104
+ 39.8% 37,817 + 14.7%
Ford E-Series
12,101
+ 13.9% 67,265 + 7.5%
Ford Transit Connect
2693
- 10.0% 16,954 + 11.9%
GMC Savana
2105
+ 14.7% 12,056 + 18.9%
Mercedes-Benz Sprinter
2140
+ 12.0% 9276 + 30.7%
Nissan NV
751
+ 69.9% 4885 + 347%
Ram Cargo Van
1141
----- 3443 -----
Source: Manufacturers & ANDC

Related From GoodCarBadCar.net
July 2012 Commercial Van Sales In America
Commercial Van Sales In America - May 2012
U.S. Auto Sales By Brand - June 2012
Top 5 Best-Selling Trucks In America - June 2012
Minivan Sales And Truck Sales In America - June 2012