 |
| Total Kia Canada Volume Rose By 12,677 Units In 2012, The Optima Was Up By 9805 Sales |
 |
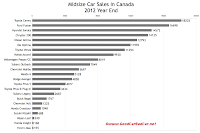
| 2012 Midsize Car Sales Chart Click Any Chart For Larger View |
If you think the Toyota Venza is more of a Camry wagon than a RAV4 crossover alternative, then Toyota was clearly the dominant midsize seller in Canada last year, beating Hyundai-Kia by more than 10,000 units.
 |
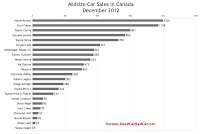
| December 2012 Midsize Car Sales Chart |
With a little help from a coupe bodystyle, the Accord nameplate took off with the ninth-generation variant's arrival. In December, for example, Canadian Accord volume jumped 179% in 2012.
 |
| 2012 Large Car Sales Chart |
The Prius V contributed more to Toyota's overall volume than the conventional Prius. Between the Prius C and Prius Plug-In, Toyota found another 2593 more Prius sales that couldn't have existed last year.
 |
| December 2012 Large Car Sales Chart |
As always, you can find historical monthly and yearly sales figures for these cars and any other vehicle by selecting a make and model at GCBC's Sales Stats home or by clicking the model name in the tables below. Fortunately, the tables below are now sortable. Click the column headers in the tables to sort by December 2012 volume or 2012 year end volume or re-sort alphabetically.
Click On Column Headers To Sort
Midsize Car | December 2012 | % Change | 2012 Year End | YTD % Change |
|---|---|---|---|---|
95 | - 67.1% | 1767 | - 37.9% | |
368 | - 26.5% | 5697 | - 47.8% | |
57 | + 78.1% | 1225 | + 345% | |
621 | + 32.1% | 14,125 | + 89.0% | |
286 | + 155% | 4858 | + 3.8% | |
75 | ----- | 155 | ----- | |
1158 | + 32.6% | 16,698 | - 9.3% | |
1201 | + 179% | 9930 | + 27.0% | |
98 | + 118% | 1048 | + 10.2% | |
9 | + 50.0% | 168 | - 30.6% | |
852 | + 19.8% | 14,572 | - 10.8% | |
473 | + 23.5% | 11,992 | + 448% | |
457 | + 73.1% | 5128 | + 39.5% | |
534 | - 44.4% | 12,793 | + 2.0% | |
27 | - 54.2% | 240 | + 41.2% | |
302 | + 63.2% | 2687 | - 13.7% | |
563 | + 4.6% | 7049 | - 0.3% | |
45 | + 40.6% | 688 | - 6.3% | |
901 | - 35.1% | 18,203 | + 47.6% | |
193 | + 239% | 3434 | + 117% | |
175 | + 207% | 3371 | + 113% | |
18 | ----- | 63 | ----- | |
242 | - 7.6% | 4077 | + 637% | |
789 | - 28.1% | 11,294 | - 14.2% | |
567 | + 52.0% | 8019 | + 167% |
Large Car | December 2012 | % Change | 2012 Year End | YTD % Change |
|---|---|---|---|---|
101 | - 50.0% | 2377 | - 16.3% | |
----- | - 100% | 557 | - 75.1% | |
303 | - 33.3% | 7733 | - 16.7% | |
252 | + 24.1% | 5760 | + 89.2% | |
327 | + 126% | 4058 | - 1.9% | |
224 | + 8.7% | 4938 | + 51.3% | |
56 | - 69.9% | 2025 | - 2.1% | |
101 | + 120% | 427 | - 13.9% |
Related From GoodCarBadCar.net
Midsize Car Sales In Canada - January 2013
Large Car Sales In Canada - January 2013
Midsize & Large Car Sales In Canada - November 2012
Midsize Car Sales In Canada - December & 2011 Year End
Large Car Sales In Canada - December & 2011 Year End
Top 25 Best-Selling Cars In Canada - 2012 Year End
Small Car Sales In Canada - December & 2012 Year End
No comments:
Post a Comment