 |
| 2012 Sporty Car Sales Chart |
 |
| December 2012 Sporty Car Sales Chart |
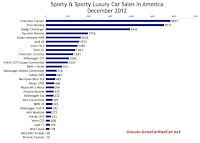
Even now that Porsche Boxster sales are healthier than they've been since 2008, the Boxster isn't selling as often as the Mercedes-Benz SLK, the dominant German roadster. Year-over-year, Boxster sales jumped 887% in December 2012, yet the SLK (up 67.3%) outsold the Porsche by 70 units. BMW's Z4 was 51 units back of the Porsche and the Audi TT was 129 sales behind the Z4.
 |
| 2012 Premium Sporty Car Sales Chart |
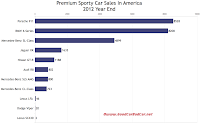
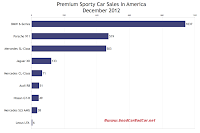
At the higher end, sales of the Audi R8, Jaguar XK, Mercedes-Benz CL-Class, and Nissan GT-R were in noticeable decline in 2012. You'll notice that the BMW's 6-Series huge increases continue, but keep in mind, the Gran
 |
| December 2012 Premium Sporty Car Sales Chart |
You can always find the sales figures for any vehicle by selecting a make and/or model at GCBC's Sales Stats home. The tables visible after the jump are now sortable: click any heading in either table to rearrange vehicles by December 2012 U.S. sales volume or year-over-year percentage change or whatever it is you wish to sort. Click the headings at the far left to sort back to alphabetical order. It's a small change, but one that makes the surveying of automotive sales data that much easier at GoodCarBadCar.net.
Click On Column Headers To Sort
Sporty Car | December 2012 | % Change | 2012 Year End | YTD % Change |
|---|---|---|---|---|
1572 | + 23.5% | 17,270 | + 12.3% | |
195 | - 9.7% | 2226 | - 0.4% | |
757 | - 17.4% | 7689 | - 12.9% | |
324 | + 8.4% | 2751 | - 20.9% | |
5837 | - 13.6% | 84,391 | - 4.4% | |
1291 | + 24.4% | 14,132 | + 7.4% | |
3942 | + 20.0% | 43,119 | + 9.1% | |
5537 | + 9.5% | 82,995 | + 17.8% | |
243 | - 56.9% | 4192 | - 63.0% | |
1976 | - 9.7% | 34,862 | + 276% | |
1034 | - 8.7% | 13,016 | - 10.2% | |
394 | + 16.2% | 6305 | + 11.1% | |
----- | - 100% | 80 | - 89.5% | |
445 | + 67.3% | 4595 | + 42.7% | |
325 | + 8.7% | 4813 | - 3.0% | |
178 | - 29.6% | 2880 | + 202% | |
273 | ----- | 2371 | ----- | |
20 | - 87.9% | 1173 | - 84.5% | |
406 | - 9.6% | 7338 | + 0.1% | |
375 | + 887% | 2894 | + 63.0% | |
10 | - 85.0% | 462 | - 66.0% | |
1495 | ----- | 11,417 | ----- | |
1383 | - 12.9% | 22,666 | + 1.0% | |
497 | ----- | 4144 | ----- | |
1642 | + 30.6% | 13,624 | - 1.3% | |
516 | + 51,500% | 520 | - 38.2% | |
372 | - 11.2% | 6214 | - 17.5% | |
1085 | - 18.5% | 16,314 | - 3.3% | |
292 | ----- | 3894 | ----- | |
208 | - 24.1% | 4441 | - 10.0% |
Premium Sporty Car | December 2012 | % Change | 2012 Year End | YTD % Change |
|---|---|---|---|---|
51 | - 61.7% | 802 | - 30.0% | |
1037 | + 43.4% | 8208 | + 110% | |
----- | - 100% | 20 | - 89.8% | |
133 | - 12.5% | 1633 | - 6.0% | |
6 | - 40.0% | 46 | - 25.8% | |
Lexus SC430 | ----- | ----- | 2 | - 88.9% |
71 | + 24.6% | 723 | - 23.3% | |
503 | + 408% | 4899 | + 238% | |
38 | - 55.8% | 800 | + 10.8% | |
49 | + 40.0% | 1188 | - 8.2% | |
519 | + 22.7% | 8528 | + 41.8% |
Mercedes-Benz USA also sold one leftover CLK in 2012.
Clearly GoodCarBadCar is not suggesting that the cars in the two tables above are all direct competitors. Establishing categories among cars as unique as even the Audi TT and Porsche Boxster has never pleased a single reader, so cars have been lumped together so you can simply see how buyers looking for sports cars, roadsters, hot hatches, convertibles, GTs, and wanna-be sports cars spend their money. Greater categorization of cars would only lead to problems that automakers create by not isolating model-specific sales figures: we don't know how many M3s BMW has sold or how many Civics are Si models, for example. The numbers we do have are listed above.
Related From GoodCarBadCar.net
Sporty Car Sales In America - January 2013
Sporty Car & Premium Sporty Car Sales In America - December & 2011 Year End
Sporty Car & Premium Sporty Car Sales In America - November 2012
Top 30 Best-Selling Luxury Vehicles In America - 2012 Year End
Top 25 Best-Selling Cars In America - 2012 Year End
U.S. Auto Sales Brand Rankings - December & 2012 Year End

No comments:
Post a Comment