Showing posts with label US January 2013. Show all posts
Wednesday, February 13, 2013

January 2013 Sporty Car Sales In America

2013 Porsche 911 Carrera 4S Coupe Brown Rear View
In the middle of winter, Porsche USA sold more 911s than in any month since May of last year. In fact, that May total was just one unit higher than what Porsche managed in January 2013. Year-over-year, 911 sales jumped 29%. The 911 was the top-selling Porsche passenger car - 289 units ahead of the Panamera - and it was responsible for 26% of Porsche volume in January 2013. 

U.S. january 2013 sports car sales chart
Click Either Chart For Larger View
Nearly 200 more 911s were sold in the United States last month than in the same period a year earlier. The arrival of the 991-gen Carrera 4 didn't hurt. Porsche also sold an extra 344 Boxsters this January than last. (A year ago, the previous-gen Boxster was dying off.) These gains, plus the Cayenne's 51% jump, were enough to cover up the Cayman's near-disappearance and the Panamera's 16% drop and enough to generate Porsche's highest-volume January in the company's history.

Compared with January 2012, the Mercedes-Benz SL-Class, Nissan GT-R, and Porsche Boxster posted triple-digit gains. Gains of more than 40% were reported by the BMW Z4, Chevrolet Corvette, and Subaru Impreza WRX. 

U.S. January 2013 premium sports car sales chartDeclines worse than 20% - in a market which grew 14%, you might recall - were posted by the Audi TT, BMW 1-Series, Infiniti non-sedan G37, Mini's Cooper Coupe, the Nissan 370Z, Volkswagen Eos, Volkswagen Golf GTI, Volvo C70, Audi R8, Jaguar XK, and Mercedes-Benz SLS AMG. Because of their low-volume nature, many of these models are prone to fluctuation.

GoodCarBadCar recently made these sporty car sales tables sortable. Simply click a column header to sort; click it again to reverse the order. Click any model name to find historical monthly and yearly sales figures, or make a model selection at GCBC's Sales Stats page. You can also click either of the accompanying charts for a larger view. 

Click Column Headers To Sort
Sporty Car
January 2013
%
Change
Year 
To Date
YTD
% Change
1200
+ 36.7%1200+ 36.7%
127
- 30.2%127- 30.2%
304
- 28.0%304- 28.0%
152
+ 46.2%152+ 46.2%
4925
- 13.7%4925- 13.7%
908
+ 44.4%908+ 44.4%
3497
+ 37.1%3497+ 37.1%
3608
- 3.4%3608- 3.4%
358
- 1.4%358- 1.4%
1759
+ 3.9%1759+ 3.9%
631
- 26.5%631- 26.5%
315
+ 2.9%315+ 2.9%
325
+ 36.6%325+ 36.6%
141
+ 11.9%141+ 11.9%
97
- 33.6%97- 33.6%
165
-----165-----
14
- 87.6%14- 87.6%
331
- 20.6%331- 20.6%
392
+ 717%392+ 717%
1
- 99.2%1- 99.2%
1443
-----1443-----
1264
- 3.4%1264- 3.4%
463
-----463-----
1306
+ 83.9%1306+ 83.9%
1730
+ 23.5%1730+ 23.5%
250
- 31.5%250- 31.5%
915
- 25.7%915- 25.7%
202
+ 5.2%202+ 5.2%
173
- 42.1%173- 42.1%

Premium Sporty Car
January 2013
%
Change
Year 
To Date
YTD
% Change
49
- 38.0%49- 38.0%
424
+ 3.7%424+ 3.7%
117
- 23.5%117- 23.5%
3
- 25.0%3- 25.0%
54
- 19.4%54- 19.4%
390
+ 290%390+ 290%
36
- 60.9%36- 60.9%
48
+ 140%48+ 140%
877
+ 28.8%877+ 28.8%
Source: Manufacturers & ANDC
* Indicates a vehicle that is also shown in another GCBC segment breakdown
** Indicates a vehicle that is represented in full in another GCBC segment breakdown
Clearly GoodCarBadCar is not suggesting that the cars in the two tables above are all direct competitors. Establishing categories among cars as unique as even the Audi TT and Porsche Boxster has never pleased a single reader, so cars have been lumped together so you can simply see how buyers looking for sports cars, roadsters, hot hatches, convertibles, GTs, and wanna-be sports cars spend their money. Greater categorization of cars would only lead to problems that automakers create by not isolating model-specific sales figures: we don't know how many M3s BMW has sold or how many Civics are Si models, for example. The numbers we do have are listed above.

Related From GoodCarBadCar.net
Sporty Car Sales In America - February 2013
Sporty Car Sales In America - December & 2012 Year End
Sporty Car Sales In America - January 2012
Top 20 Best-Selling Cars In America - January 2013
U.S. Auto Sales Brand Rankings - January 2013
Monday, February 11, 2013

January 2013 Large Luxury Car Sales In America

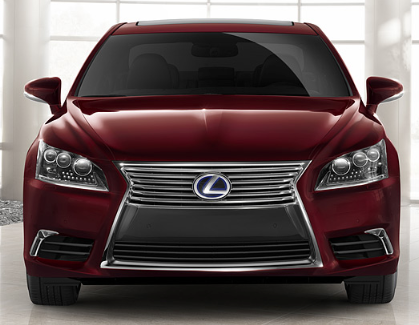
2013 Lexus LS600hL Matador Red
Surging LS sales propelled the biggest Lexus to a segment victory in January 2013. The Lexus LS has a big advantage over cars like the similarly-popular Mercedes-Benz S-Class. Its base price, $71,990, is $23,010 lower than the base price of Mercedes-Benz's least expensive V8 S-Class. 

In fact, the LS's price puts it closer to the Hyundai Equus (shown in a separate table below with other not-quite-Panamera-fighting-sedans) than it is to the S-Class. The same could be said of the Jaguar XJ, Audi A8


U.S. January 2013 large luxury car sales chart
Click Chart For Larger View
During the first ten months of 2012, Lexus couldn't manage more than 1000 units in a month. It's safe to assume that Lexus won't sell 35,000 LS460s and LS600 hybrids this year like they did in 2007, when the overall market was larger. But 13,000-16,000 units seems possible. Last year, the segment-leading S-Class sold 11,794 times.

In this and other segment breakdowns, GoodCarBadCar has made some changes so observers can see all possible comparables in one place. In this large luxury car sales post, however, the accompanying chart does not include the four sub-$60K cars which, on pricing grounds, GCBC also displays with midsize luxury cars.

The tables below are now sortable - click any column's header to arrange by volume or year-over-year change. As always, you can click any model name to find historical monthly and yearly sales figures.

Click Column Headers To Sort
Large Luxury Car
January 2013
%
Change
Year 
To Date
YTD
% Change
504
+ 55.6%504+ 55.6%
424
+ 3.7%424+ 3.7%
583
- 40.3%583- 40.3%
401
+ 6.4%401+ 6.4%
1077
+ 88.0%1077+ 88.0%
938
+ 19.5%938+ 19.5%
588
- 16.4%588- 16.4%

Large (Cheaper) 
Luxury Cars
January 
2013
%
Change
Year 
To Date
YTD
% Change
Cadillac DTS *
3
- 96.6%3- 96.6%
1900
-----1900-----
253
- 13.4%253- 13.4%
909
+ 22.7%909+ 22.7%
Source: Manufacturers & ANDC
* Indicates a vehicle that is also shown in another GCBC segment breakdown

Related From GoodCarBadCar.net
Large Luxury Car Sales In America - February 2013
Large Luxury Car Sales In America - December & 2012 Year End
Large Luxury Car Sales In America - January 2012
Top 15 Best-Selling Expensive Cars In America - January 2013
U.S. Auto Sales Brand Rankings - January 2013
Luxury Car Sales In America - January 2013

January 2013 Luxury Car Sales In America

2003 Volvo V70 R
Volvo Sold 10,489 V70 Wagons (Besides 16,066 More XC70s) In
2004, When The Overall Market Was 1.17 Times The Size It Is Now
The Volvo S60 accounted for 40% of U.S. Volvo sales in January 2013, up from 32% a year ago and 38% a month ago. S60 sales shot up 20% in January, a 393-unit increase from January 2012 levels. The  S40, V50, and V70, meanwhile, are dead. S80 sales dropped 17% to 176. The C30 and C70 were responsible for just 7% of Volvo sales last month. The surging XC60 brought about another 32% of Volvo brand sales.

January 2013 U.S. small luxury car sales chart
Click Either Chart For Larger View
You've figured it out: Volvo, at least in America, is an S60/XC60-oriented company. This reliance on specific models isn't unusual among semi-premium brands. The MKX accounted for 44% of Lincoln sales in January; the G and JX were responsible for nearly seven out of ten Infiniti sales last month; the ES and RX just under one-third of all Lexus sales in January. 71% of Porsche sales came about as a result of the Cayenne and 911. 

But the biggest luxury players find decent U.S. volume with a wide range of models. BMW possesses four models - two cars and two SAVs which sold more often than the most popular Volvo. Mercedes-Benz had five, including two cars. Cadillac's SRX, ATS, and CTS outsold the leading Volvo. Acura's MDX and RDX did the same. As did Infiniti's G and JX; Lexus's ES and RX; Audi's A4 and Q5.


U.S. January 2013 midsize luxury car sales chart
This isn't Volvo bashing. And while plenty of automakers sell fewer cars these days than in the pre-recession era - Volvo sales plunged 51% from 2004 to 2012; Lexus dropped 19% between 2005 and 2012  - Volvo market share slid from 0.8% in 2004 to 0.5% in 2012. And why? It doesn't help that Volvo sold nine different models in 2004 but only sells seven now, and two of the seven are on their way out. This is about Volvo wishing. Wishing that the brand would be inspired by its history. Wishing that it would update aging products. Sure, an S60 Polestar looks like fun. But before Volvo needs an M3-baiter, it might need... you know, a wagon.

This luxury car sales post has been wholeheartedly changed. It now includes a number of cars GCBC displays with other segments, too, like the Chrysler 300 and Buick Verano. These additions allow readers to see how cars fare against similarly-priced nameplates, not just the cars that have a lofty brand image. The accompanying charts can be clicked for a larger view. Any model can be clicked in order to find historical monthly and yearly sales figures. Or select a make and model at GCBC's Sales Stats home. Best of all, the tables below are now sortable. Click any column header to rank vehicles by volume, year-over-year change, or re-sort alphabetically to return to the original.

Click Column Headers To Sort
Entry Luxury Car
January 2013
%
Change
Year 
To Date
YTD
% Change
1558
-----1558-----
231
- 60.5%231- 60.5%
3660
+ 360%3660+ 360%
1001
- 2.3%1001- 2.3%
166
- 42.8%166- 42.8%

Small Luxury Car
January 2013
%
Change
Year 
To Date
YTD
% Change
1326
- 41.5%1326- 41.5%
2755
+ 3.0%2755+ 3.0%
1200
+ 36.7%1200+ 36.7%
304
- 28.0%304- 28.0%
4831
- 27.9%4831- 27.9%
2781
-----2781-----
2505
- 17.0%2505- 17.0%
2815
- 26.2%2815- 26.2%
1386
- 23.4%1386- 23.4%
7214
+ 19.6%7214+ 19.6%
1954
+ 38.1%1954+ 38.1%

Tweeners
January 2013
%
Change
Year 
To Date
YTD
% Change
1497
- 34.4%1497- 34.4%
3548
- 11.6%3548- 11.6%
5325
+ 7.4%5325+ 7.4%
797
+ 4328%797+ 4328%
2472
+ 7.9%2472+ 7.9%
5186
+ 115%5186+ 115%
453
- 72.7%453- 72.7%
2992
- 25.2%2992- 25.2%
4840
+ 50.4%4840+ 50.4%
1192
- 15.8%1192- 15.8%
334
- 24.6%334- 24.6%

Midsize Luxury Cars 

Large Inexpensive 
Luxury Cars
January 2013
%
Change
Year 
To Date
YTD
% Change
13
- 60.6%13- 60.6%
1259
+ 11.4%1259+ 11.4%
698
+ 8.6%698+ 8.6%
2585
- 19.6%2585- 19.6%
1900
-----1900-----
253
- 13.4%253- 13.4%
413
- 41.0%413- 41.0%
511
+ 12.3%511+ 12.3%
1099
+ 1082%1099+ 1082%
909
+ 22.7%909+ 22.7%
553
- 5.0%553- 5.0%
5469
+ 33.5%5469+ 33.5%
176
- 16.6%176- 16.6%
Source: Manufacturers & ANDC
* Indicates a vehicle that is also shown in another GCBC segment breakdown

Related From GoodCarBadCar.net
Small & Midsize Luxury Car Sales In America - February 2013
Small & Midsize Luxury Car Sales In America - December & 2012 Year End
Small & Midsize Luxury Car Sales In America - January 2012
Top 15 Best-Selling Expensive Cars In America - January 2013
U.S. Auto Sales Brand Rankings - January 2013
Large Luxury Car Sales In America - January 2013