 |
| 2012 Sporty Car Sales Chart Click Any Chart For A Larger View |
Don't take the Mustang's victory to mean muscle car sales are roaring in Canada. For one thing, you already know that the Camaro is crumbling. But Dodge Challenger sales are disappearing, as well, falling 37% in 2012 after falling 24% in 2011. And the Mustang? Ford sold nearly twice as Many Mustangs in 2005 as in 2012, even though the overall Canadian new vehicle market has experienced 6% growth since 2005.
 |
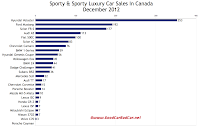
| December 2012 Sporty Car Sales Chart |
Healthy growth was enjoyed by the Porsche Boxster, which sold at a better rate than it has since 2008, when 277 were sold. Porsche Canada once again sold 277 Boxsters, but in 2012, the majority of the Boxsters sold were third-generation Good 12-winning 981 Boxsters, not second-generation 987 Boxsters.
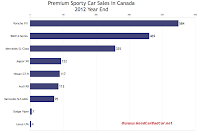
As recently as 2005, Canadians registered more than 400 Boxsters. Its popularity also pales in comparison to the popularity of Porsche's own 911, which recorded a 23% jump to 584 sales in 2012. This made 2012 the 911's best Canadian sales year since 2007, when 660 were registered.
 |
| 2012 Premium Sports Car Sales Chart |
 |
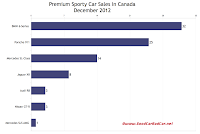
| December 2012 Premium Sporty Car Sales Chart |
As always, you can find historical monthly and yearly sales figures for these cars and any other vehicle by selecting a make and model at GCBC's Sales Stats home or by clicking the model name in the table below. Fortunately, the table is now sortable. Click the column headers in the tables to sort by December 2012 volume or 2012 year end volume or re-sort alphabetically.
Click On Column Headers To Sort
Sporty Car | December 2012 | % Change | 2012 Year End | YTD % Change |
|---|---|---|---|---|
113 | + 50.7% | 2024 | + 3.9% | |
17 | + 6.3% | 454 | + 0.9% | |
59 | - 6.3% | 1093 | - 29.8% | |
44 | + 175% | 358 | + 3.8% | |
76 | - 52.5% | 2557 | - 31.8% | |
15 | - 6.3% | 250 | - 29.0% | |
41 | - 36.9% | 1485 | - 36.8% | |
100 | + 53.8% | 2222 | + 301% | |
192 | + 17.8% | 5181 | + 16.9% | |
7 | - 50.0% | 238 | - 54.0% | |
56 | - 52.9% | 1773 | - 36.9% | |
353 | - 13.1% | 5741 | + 202% | |
9 | + 80.0% | 293 | + 5.0% | |
7 | + 250% | 61 | - 3.2% | |
10 | - 47.4% | 711 | + 16.2% | |
----- | - 100% | 43 | - 73.9% | |
22 | + 4.8% | 512 | + 36.5% | |
7 | - 69.6% | 241 | - 59.2% | |
7 | - 58.8% | 489 | + 7.9% | |
14 | + 367% | 277 | + 83.4% | |
----- | - 100% | 92 | - 25.8% | |
177 | ----- | 1470 | ----- | |
83 | - 37.1% | 1508 | - 26.3% | |
36 | ----- | 504 | ----- | |
45 | + 80.0% | 678 | - 4.2% | |
3 | 0.0% | 137 | - 12.2% |
Premium Sporty Car | December 2012 | % Change | 2012 Year End | YTD % Change |
|---|---|---|---|---|
3 | + 50.0% | 112 | - 23.8% | |
32 | - 5.9% | 469 | + 129% | |
----- | - 100% | 7 | - 78.8% | |
8 | - 50.0% | 122 | - 17.6% | |
----- | - 100% | 4 | 0.0% | |
14 | + 55.6% | 335 | + 75.4% | |
1 | - 90.0% | 95 | - 13.6% | |
3 | + 200% | 117 | + 62.5% | |
25 | + 150% | 584 | + 22.9% |
Clearly GoodCarBadCar is not suggesting that the cars in the two tables above are all direct competitors. Establishing categories among cars as unique as even the Audi TT and Porsche Boxster has never pleased a single reader, so cars have been lumped together so you can simply see how buyers looking for sports cars, roadsters, hot hatches, convertibles, GTs, and wanna-be sports cars spend their money. Greater categorization of cars would only lead to problems that automakers create by not isolating model-specific sales figures: we don't know how many M3s BMW has sold or how many Civics are Si models, for example. The numbers we do have are listed above.
Related From GoodCarBadCar.net
Sporty Car Sales In Canada - January 2013
Sporty & Premium Sporty Car Sales In Canada - December & 2011 Year End
Sporty & Premium Sporty Car Sales In Canada - November 2012
Top 25 Best-Selling Cars In Canada - 2012 Year End
Canada Auto Sales Brand Rankings - December & 2012 Year End

No comments:
Post a Comment