 |
| Not Their Biggest Seller, But Land Rover's Defender Is Positively British |
December 2012 was predictably the third-lowest sales month of the year. We won't spend much time analyzing December numbers, but it should be noted that BMW outsold Volkswagen in the final month of the year. Among major brands, BMW's 35% year-over-year increase in December was topped only by Kia, Honda, and Fiat.
Brands and manufacturers are ranked by 2012 year end volume in the two tables below. (This explains why, before sorting, Volkswagen is shown above BMW, and Audi above Nissan.) Fortunately, as you might have already guessed, this post is the first to include a new GoodCarBadCar.net feature: it's sortable. Click any of the headings in order to sort all 43 brands by name, December 2012 sales, year-over-year change from December 2011, year end volume, or year-over-year change for the full year as compared with 2011. While we regret not offering this feature in the past, it's an exciting addition. At any time, click the column heading again to switch the direction.
 |
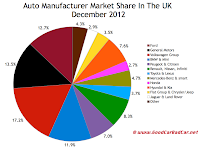
| Click December 2012 Market Share Chart For Larger View |
As for British brands, Lotus was the only deep disappointment in 2012. Sales plunged 58% from 2011's already low 329 sales, which you might recall, was down from 43% from 577 in 2010. Jaguar and Mini were up just 2.3% and 2.4%, respectively, but Land Rover registrations shot up 29%, undoubtedly helped by the addition of the Range Rover Evoque.
What do North American car enthusiasts know of British car culture? Historically, the magazine covers we saw included plenty of WRX Imprezas and Mitsubishi Evos. Subaru UK won't be selling the WRX any longer, not that it was helping much. Subaru sales plummeted 23% in 2012, dragging the brand down to a ranking of 32, behind smart, Chrysler, and Jeep. Meanwhile, Mitsubishi sales fell 33.5% in 2012. Neither of these two brands fared well in 2011, either, as Subaru had already dropped 32% and Mitsubishi slid 19% before 2012 brought with it further declines.
 |
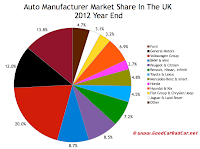
| Click 2012 Market Share Chart For Larger View |
UK 2012 auto sales figures for 43 brands are in the first table below. The twelve largest automotive conglomerates are then shown in a secondary table, which is also sortable. GoodCarBadCar.net posted the UK's best-selling cars earlier this morning. Click either of the two accompanying market share pie charts in this post for larger views.
Click Any Column Heading To Sort Table By Rank, Automaker, % Change etc.
Rank | Automaker | December 2012 | % Change | 2012 Year End | Year End % Change |
|---|---|---|---|---|---|
#1 | Ford | 15,656 | + 6.6% | 281,917 | + 6.0% |
#2 | Vauxhall | 16,272 | + 3.1% | 232,255 | - 1.1% |
#3 | Volkswagen | 9651 | - 8.5% | 183,098 | + 2.1% |
#4 | BMW | 10,175 | + 35.0% | 127,530 | + 9.3% |
#5 | Audi | 4786 | - 24.2% | 123,622 | + 8.6% |
#6 | Nissan | 6441 | + 11.3% | 105,835 | + 9.9% |
#7 | Peugeot | 4757 | + 2.5% | 99,486 | + 4.7% |
#8 | Mercedes-Benz | 5261 | + 9.3% | 91,855 | + 12.2% |
#9 | Toyota | 4149 | - 24.5% | 84,563 | + 14.9% |
#10 | Hyundai | 5551 | + 2.4% | 74,285 | + 18.1% |
#11 | Citroen | 3935 | - 2.4% | 73,656 | + 7.6% |
#12 | Kia | 3890 | + 55.0% | 66,629 | + 24.3% |
#13 | Honda | 3331 | + 47.3% | 54,208 | + 7.2% |
#14 | Skoda | 3199 | + 11.2% | 53,602 | + 19.0% |
#15 | Mini | 4499 | + 5.2% | 51,324 | + 2.4% |
#16 | Fiat | 3260 | + 48.0% | 49,907 | + 19.9% |
#17 | Land Rover | 2532 | - 7.8% | 48,626 | + 29.2% |
#18 | Renault | 3733 | - 17.9% | 40,760 | - 40.5% |
#19 | Seat | 2799 | + 12.6% | 38,798 | + 7.5% |
#20 | Volvo | 2030 | + 1.5% | 31,790 | - 2.7% |
#21 | Mazda | 970 | - 40.7% | 26,183 | - 16.1% |
#22 | Suzuki | 1564 | + 28.0% | 24,893 | + 22.7% |
#23 | Jaguar | 1054 | + 29.6% | 14,109 | + 2.3% |
#24 | Chevrolet | 436 | - 38.2% | 13,476 | + 7.6% |
#25 | Lexus | 390 | - 42.9% | 8404 | + 1.6% |
#26 | Porsche | 761 | + 6.0% | 7998 | + 25.3% |
#27 | Alfa Romeo | 290 | - 52.3% | 7253 | - 37.3% |
#28 | Mitsubishi | 735 | + 56.7% | 6549 | - 33.5% |
#29 | Smart | 514 | + 53.4% | 5616 | + 11.3% |
#30 | Chrysler | 135 | + 23.9% | 3333 | + 182.0% |
#31 | Jeep | 120 | - 43.7% | 2306 | + 7.5% |
#32 | Subaru | 92 | - 34.8% | 2023 | - 23.2% |
#33 | Abarth | 120 | + 53.9% | 1292 | + 0.8% |
#34 | Bentley | 83 | + 62.8% | 1267 | + 22.2% |
#35 | Aston Martin | 64 | + 20.8% | 932 | - 9.0% |
#36 | Ssangyong | 65 | + 27.5% | 875 | + 351% |
#37 | MG | 93 | - 16.2% | 782 | + 117% |
#38 | Infiniti | 42 | + 23.5% | 530 | + 38.7% |
#39 | Perodua | 22 | + 4.8% | 416 | - 23.4% |
#40 | Maserati | 14 | - 22.2% | 309 | - 20.4% |
#41 | Saab | 0 | - 100% | 232 | - 94.4% |
#42 | Proton | 1 | - 95.2% | 208 | - 53.4% |
#43 | Lotus | 14 | + 40.0% | 137 | - 58.4% |
Click Any Column Heading To Sort Table By Rank, Automaker, % Change etc.
Rank | Automaker | December 2012 | % Change | 2012 Year End | YTD % Change |
|---|---|---|---|---|---|
#1 | Volkswagen Group | 21,279 | - 7.4% | 408,385 | + 7.0% |
#2 | Ford Motor Company | 15,656 | + 6.6% | 281,917 | + 6.0% |
#3 | General Motors | 16,708 | + 1.3% | 245,731 | - 0.6% |
#4 | BMW-Mini | 14,674 | + 24.2% | 178,854 | + 7.2% |
#5 | PSA Peugeot & Citroen | 8692 | + 0.2% | 173,142 | + 5.9% |
#6 | RNA Renault, Nissan & Infiniti | 10,216 | - 1.5% | 147,125 | - 10.9% |
#7 | Hyundai-Kia | 9441 | + 19.0% | 140,914 | + 20.9% |
#8 | Daimler AG | 5775 | + 12.1% | 97,471 | + 12.1% |
#9 | Toyota UK | 4539 | - 26.5% | 92,967 | + 13.6% |
#11 | Fiat Group & Chrysler-Jeep | 4384 | + 35.8% | 64,845 | + 10.8% |
#10 | Jaguar-Land Rover | 3586 | + 7.3% | 62,735 | + 22.0% |
#12 | Honda | 3331 | + 47.3% | 54,208 | + 7.2% |
--- | Total | 123,557 | + 3.7% | 2,044,609 | + 5.3% |
UK Auto Sales Brand Rankings - 2011 Year End
UK Auto Sales Brand Rankings - November 2012
UK Auto Sales Brand Rankings - December 2011
Historical Monthly & Yearly UK Total Car Market Size Figures
Top 10 Best-Selling Cars In The UK - 2012 Year End
Top 10 Best-Selling Cars In The UK - December 2012
No comments:
Post a Comment