 |
| Not Much For Indepenent Suspension, But The Jeep Wrangler Sells |
 |
| Click Chart For Larger View |
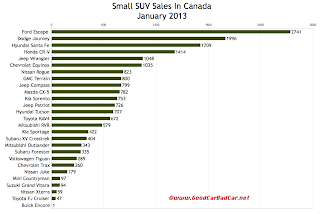
Last month was Hyundai Canada's best January sales month ever. Also in January, Jeep reported the Wrangler's 23rd consecutive year-over-year Canadian sales increase. Both are featured with the small SUVs in the first table below; Wrangler figures are also displayed with the Xterra and Toyota FJ Cruiser in a separate table at the bottom of this post. The Wrangler, Santa Fe, Kia Sorento, Xterra, and FJ are also displayed with midsize SUVs and crossovers either because of size or price or cross-cultural appeal or simply because of GCBC's thorough nature.
Dreadful small SUV/CUV sales declines were posted by the Honda CR-V, Hyundai Tucson, Nissan Rogue, Suzuki Grand Vitara, and rather predictably, the Toyota RAV4. Keep in mind, January doesn't necessarily set a precedent for 2013. It's the lowest-volume month of the year and one that can be hugely skewed by harsh weather. Do you go car-shopping in this?
Historical monthly and yearly sales figures for any of these utilities can be found by clicking the model name in the tables below or by making a selection at GCBC's Sales Stats page. The tables are now sortable, so you can rank vehicles however you like or view them alphabetically. If you're only interested in the best sellers, GCBC published a list of the top 20 last week.
Click Header Columns To Sort
Small SUVs & Crossovers | January 2013 | % Change | Year To Date | YTD % Change |
|---|---|---|---|---|
1035 | - 17.9% | 1035 | - 17.9% | |
1996 | + 2.3% | 1996 | + 2.3% | |
2741 | + 24.1% | 2741 | + 24.1% | |
800 | + 15.1% | 800 | + 15.1% | |
1414 | - 26.7% | 1414 | - 26.7% | |
1709 | + 25.2% | 1709 | + 25.2% | |
707 | - 21.4% | 707 | - 21.4% | |
799 | + 74.8% | 799 | + 74.8% | |
726 | + 12.7% | 726 | + 12.7% | |
1048 | + 43.8% | 1048 | + 43.8% | |
753 | - 18.5% | 753 | - 18.5% | |
422 | - 4.3% | 422 | - 4.3% | |
782 | ----- | 782 | ----- | |
343 | - 0.6% | 343 | - 0.6% | |
823 | - 23.2% | 823 | - 23.2% | |
335 | - 15.6% | 335 | - 15.6% | |
94 | - 19.7% | 94 | - 19.7% | |
672 | - 52.9% | 672 | - 52.9% | |
289 | - 18.4% | 289 | - 18.4% |
Smallest SUVs & Crossovers | January 2013 | % Change | Year To Date | YTD % Change |
|---|---|---|---|---|
1 | ----- | ----- | ||
260 | ----- | 260 | ----- | |
97 | + 56.5% | 97 | + 56.5% | |
579 | + 26.1% | 579 | + 26.1% | |
179 | - 19.7% | 179 | - 19.7% | |
404 | ----- | 404 | ----- |
Offroaders | January 2013 | % Change | Year To Date | YTD % Change |
|---|---|---|---|---|
1048 | + 43.8% | 1048 | + 43.8% | |
59 | - 20.3% | 59 | - 20.3% | |
47 | + 9.3% | 47 | + 9.3% |
Red font indicates declining year-over-year sales
* indicates a model that is also displayed in another GCBC segment breakdown
Related From GoodCarBadCar.net
Small SUV & Crossover Sales In Canada - February 2013
Small SUV Sales In Canada - December & 2012 Year End
Small SUV Sales In Canada - January 2012
Top 20 Best-Selling SUVs In Canada - January 2013
Canada Auto Sales Brand Rankings - January 2013
Large SUV Sales In Canada - January 2013
Midsize SUV Sales In Canada - January 2013
No comments:
Post a Comment