 |
| Click Chart For Larger View |
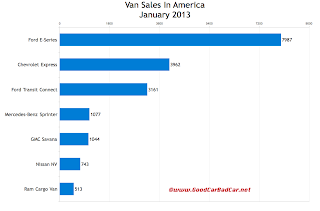
Ford's E-Series was responsible for 43% of the sector. Including the Transit Connect, Ford grabbed 60% of the sector. The E-Series outsold all non-Ford vans combined.
You can click the model name of any of these vehicles to find historical monthly and yearly sales figures. The accompanying chart can be clicked for a larger view - it ranks the vans by January volume. You can do the same by sorting the table below. Click any column header to switch the order around.
Source: Manufacturers & ANDC
Related From GoodCarBadCar.net
Commercial Van Sales In America - February 2013
Commercial Van Sales In America - December & 2012 Year End
Minivan Sales In America - January 2013
Pickup Truck Sales In America - January 2013
U.S. Auto Sales Brand Rankings - January 2013
You can click the model name of any of these vehicles to find historical monthly and yearly sales figures. The accompanying chart can be clicked for a larger view - it ranks the vans by January volume. You can do the same by sorting the table below. Click any column header to switch the order around.
Van | January 2013 | % Change | Year To Date | YTD % Change |
|---|---|---|---|---|
3962 | - 12.6% | 3962 | - 12.6% | |
7987 | + 17.7% | 7987 | + 17.7% | |
3161 | + 46.8% | 3161 | + 46.8% | |
1044 | + 24.6% | 1044 | + 24.6% | |
1077 | + 16.6% | 1077 | + 16.6% | |
743 | - 1.7% | -743 | - 1.7% | |
513 | + 26.4% | 513 | + 26.4% |
Related From GoodCarBadCar.net
Commercial Van Sales In America - February 2013
Commercial Van Sales In America - December & 2012 Year End
Minivan Sales In America - January 2013
Pickup Truck Sales In America - January 2013
U.S. Auto Sales Brand Rankings - January 2013
No comments:
Post a Comment