 |
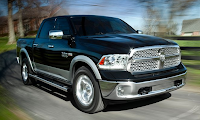
| The Chrysler Group's Best-Selling Model, The Ram Pickup |
Retail operations weren't to lackluster from the two bigger Detroit corporations. In fact, Ford retail sales were up 2%. Meanwhile, at GM, fleet sales were down 15%.
 |
| Click Either Market Share Chart For A Larger View |
Through seven months, America's new vehicle market is running at a pace that's some 14% better than last year. ToMoCo alone added 267,404 extra sales.
You can access a free database full of historical monthly and yearly sales figures for every model on sale in America through the first dropdown menu at GCBC's Sales Stats home or near the top right of this page. U.S. best seller lists for cars, trucks, and SUVs will also be published later this afternoon. Keep hitting refresh.
Updated 08.01.2012 @ 5:42 PM AT
Rank | Automaker | July 2012 | % Change | Year To Date | YTD % Change |
#1 | Ford | 166,507 | - 3.5% | 1,264,928 | + 5.4% |
| #2 | Toyota | 139,759 | + 23.9% | 1,042,602 | + 28.6% |
#3 | Chevrolet | 138,942 | - 6.8% | 1,100,604 | + 4.5% |
#4 | Honda | 104,119 | + 46.4% | 732,165 | + 18.5% |
#5 | Nissan | 86,722 | + 12.3% | 610,066 | + 14.1% |
#6 | Hyundai | 62,021 | + 4.1% | 418,690 | + 9.5% |
#7 | Kia | 48,074 | + 5.6% | 336,781 | + 15.9% |
#8 | Jeep | 41,559 | + 7.4% | 283,106 | + 24.4% |
#9 | Volkswagen | 37,014 | + 27.3% | 245,739 | + 34.1% |
#10 | Dodge | 35,630 | + 58.7% | 297,208 | + 12.8% |
#11 | GMC | 34,487 | - 9.0% | 235,528 | + 4.5% |
#12 | Subaru | 25,183 | + 15.9% | 189,487 | + 23.2% |
#13 | Ram | 24,398 | + 15.0% | 166,881 | + 18.1% |
#14 | Mercedes-Benz | 21,514 | + 3.7% | 159,384 | + 14.9% |
#15 | BMW | 21,297 | - 0.5% | 147,801 | + 9.4% |
#16 | Chrysler | 20,792 | + 34.8% | 188,546 | + 69.1% |
#17 | Mazda | 19,318 | - 7.0% | 163,115 | + 13.9% |
#18 | Lexus | 18,235 | + 25.4% | 126,367 | + 23.2% |
#19 | Buick | 14,391 | - 14.7% | 104,589 | - 5.3% |
#20 | Cadillac | 13,417 | + 20.7% | 76,229 | - 12.6% |
#21 | Acura | 12,825 | + 36.4% | 85,761 | + 22.4% |
#22 | Audi | 11,707 | + 28.0% | 76,865 | + 18.2% |
#23 | Infiniti | 11,619 | + 56.8% | 65,996 | + 20.7% |
#24 | Lincoln | 6975 | - 10.7% | 48,937 | - 1.8% |
#25 | Scion | 6904 | + 97.3% | 42,025 | + 39.5% |
#26 | Mini | 5855 | + 24.3% | 37,914 | + 9.8% |
#27 | Volvo | 5717 | + 2.2% | 40,333 | - 3.7% |
#28 | Mitsubishi | 4194 | - 47.4% | 37,067 | - 28.8% |
#29 | Fiat | 3710 | + 22.1% | 24,416 | + 206% |
#30 | Land Rover | 3320 | + 18.1% | 24,311 | + 20.9% |
#31 | Porsche | 2803 | + 1.3% | 19,253 | + 5.2% |
#32 | Suzuki | 2266 | - 7.4% | 15,260 | - 3.7% |
#33 | Jaguar | 1011 | + 2.7% | 7517 | + 1.7% |
#34 | smart | 780 | + 139% | 5528 | + 1591% |
#35 | Maserati | 208 | + 4.5% | 1496 | + 15.4% |
#36 | Bentley | 172 | + 21.1% | 1249 | + 26.8% |
--- | ----- | ----- | ----- | ----- | ----- |
----- | General Motors | 201,237 | - 6.4% | 1,516,950 | + 2.7% |
---- | Ford Motor Company | 173,482 | - 3.8% | 1,313,865 | + 5.1% |
---- | Toyota Motor Corporation | 164,898 | + 26.1% | 1,210,993 | + 28.3% |
---- | Chrysler Group | 126,089 | + 12.6% | 960,157 | + 27.7% |
---- | American Honda | 116,944 | + 45.3% | 817,926 | + 18.9% |
---- | Hyundai-Kia | 110,095 | + 4.8% | 755,471 | + 12.3% |
---- | Nissan USA | 98,341 | + 16.2% | 676,062 | + 14.7% |
--- | Volkswagen Group | 51,696 | + 25.7% | 343,106 | + 28.2% |
--- | BMW-Mini | 27,152 | + 4.0% | 185,715 | + 9.5% |
---- | Daimler AG | 22,294 | + 5.8% | 164,912 | + 18.6% |
---- | Jaguar-Land Rover | 4331 | + 14.1% | 31,828 | + 15.8% |
--- | ----- | ----- | ----- | ----- | ----- |
--- | Total | 1,153,759 | + 8.9% | 8,425,949 | + 14.0% |
Related From GoodCarBadCar.net
U.S. Auto Sales By Brand - August 2012
U.S. Auto Sales By Brand - June 2012
U.S. Auto Sales By Brand - May 2012
U.S. Auto Sales By Brand - July 2011
All 261 Vehicles Ranked By U.S. July 2012 YTD Volume

No comments:
Post a Comment