The SMMT says July 2012 was the fifth consecutive month of improved year-over-year sales results in the United Kingdom. The industry posted a positive adjustment of 9.3%, pulling the seven-month total up 3.5% compared with the January-July period of 2011.
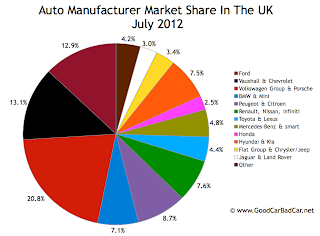
Specific results for each and every brand can be seen in the table below. The accompanying chart, which you can click for a larger view, displays July market share figures for the biggest manufacturers.
Notable facts from July's results include: Ford's slim victory over Vauxhall (Ford outsold Vauxhall by 2320 units in June but only 528 units in July); Audi's luxury segment victory over a sliding BMW; Kia's out-selling of Citroen, Skoda, Fiat, Honda, and Hyundai; Renault's dreadful 30% drop; Lotus's paltry total figures and torrential downfall from July 2011 levels; and the massive gains achieved by Fiat, Land Rover, Porsche, Lexus, and Chrysler.
Back at the beginning of the month GoodCarBadCar.net published posts just like this one for the United States and Canada. Ford led the way in each of these three countries. Other similarities between the UK and North American markets are nearly nonexistent.
Source: Automakers & SMMT
Specific results for each and every brand can be seen in the table below. The accompanying chart, which you can click for a larger view, displays July market share figures for the biggest manufacturers.
Notable facts from July's results include: Ford's slim victory over Vauxhall (Ford outsold Vauxhall by 2320 units in June but only 528 units in July); Audi's luxury segment victory over a sliding BMW; Kia's out-selling of Citroen, Skoda, Fiat, Honda, and Hyundai; Renault's dreadful 30% drop; Lotus's paltry total figures and torrential downfall from July 2011 levels; and the massive gains achieved by Fiat, Land Rover, Porsche, Lexus, and Chrysler.
Back at the beginning of the month GoodCarBadCar.net published posts just like this one for the United States and Canada. Ford led the way in each of these three countries. Other similarities between the UK and North American markets are nearly nonexistent.
Rank | Automaker | July 2012 | % Change | Year To Date | YTD % Change |
#1 | Ford | 18,527 | + 9.3% | 168,905 | + 3.8% |
#2 | Vauxhall | 17,999 | + 11.1% | 133,931 | - 6.8% |
#3 | Volkswagen | 13,435 | - 1.5% | 109,240 | + 1.2% |
#4 | Audi | 9094 | + 13.1% | 75,099 | + 7.3% |
#5 | Nissan | 8313 | + 14.0% | 62,290 | + 11.3% |
#6 | BMW | 7302 | - 9.4% | 71,816 | + 4.6% |
#7 | Peugeot | 7142 | + 8.5% | 59,624 | + 3.1% |
#8 | Mercedes-Benz | 6615 | + 11.2% | 54,405 | + 14.2% |
#9 | Toyota | 5740 | + 25.2% | 51,039 | + 19.0% |
#10 | Kia | 5593 | + 25.2% | 39,071 | + 23.1% |
#11 | Citroen | 5344 | + 17.7% | 42,674 | + 5.3% |
#12 | Hyundai | 5226 | + 32.7% | 40,394 | + 13.7% |
#13 | Skoda | 4238 | + 25.7% | 32,314 | + 17.1% |
#14 | Fiat | 3712 | + 40.7% | 29,197 | + 13.3% |
#15 | Honda | 3619 | + 26.3% | 31,130 | + 7.8% |
#16 | Land Rover | 3436 | + 62.6% | 29,511 | + 33.7% |
#17 | Mini | 2914 | + 19.5% | 27,528 | + 1.7% |
#18 | Renault | 2547 | - 29.7% | 22,122 | - 45.3% |
#19 | Seat | 2388 | - 12.5% | 21,574 | + 1.6% |
#20 | Volvo | 2016 | - 8.0% | 19,313 | - 3.5% |
#21 | Mazda | 1825 | + 16.3% | 16,859 | - 11.4% |
#22 | Suzuki | 1398 | + 19.3% | 14,166 | + 20.3% |
#23 | Jaguar | 892 | - 7.7% | 7999 | + 1.8% |
#24 | Chevrolet | 846 | - 15.2% | 9657 | + 21.6% |
#25 | Porsche | 702 | + 41.2% | 4641 | + 34.3% |
#26 | Lexus | 578 | + 84.1% | 5329 | + 20.3% |
#27 | Alfa Romeo | 496 | - 28.5% | 4654 | - 35.2% |
#28 | Chrysler | 422 | + 696% | 2028 | + 454% |
#29 | smart | 333 | + 5.7% | 3015 | - 3.1% |
#30 | Mitsubishi | 319 | - 38.4% | 3868 | - 41.4% |
#31 | Subaru | 130 | + 78.1% | 1364 | - 13.0% |
#32 | Jeep | 127 | - 9.3% | 1308 | + 10.2% |
#33 | Bentley | 118 | + 26.9% | 781 | + 14.9% |
#34 | Ssangyong | 84 | 0.0% | 504 | + 4940% |
#35 | Abarth | 69 | - 19.8% | 676 | - 13.3% |
#36 | Aston Martin | 67 | - 16.3% | 549 | - 17.4% |
#37 | Infiniti | 33 | + 22.2% | 329 | + 74.1% |
#38 | Perodua | 27 | - 48.1% | 272 | - 21.6% |
#39 | Saab | 24 | - 86.1% | 200 | - 94.6% |
#40 | MG | 23 | - 36.1% | 553 | + 239% |
#41 | Proton | 19 | - 20.8% | 174 | - 44.1% |
#42 | Lotus | 17 | - 62.2% | 99 | - 62.4% |
#43 | Maserati | 15 | - 65.9% | 186 | - 27.6% |
--- | ----- | ----- | ----- | ----- | ----- |
Volkswagen Group | 29,975 | + 5.7% | 243,649 | + 5.5% | |
Ford Motor Company | 18,527 | + 1.5% | 168,905 | + 3.8% | |
General Motors | 18,845 | + 9.6% | 143,588 | - 5.3% | |
PSA (Peugeot & Citroen) | 12,486 | + 12.3% | 102,298 | + 4.0% | |
RNA (Renault, Nissan & Infiniti) | 10,893 | - 0.4% | 84,871 | - 12.1% | |
Hyundai-Kia | 10,819 | + 28.8% | 79,465 | + 18.1% | |
BMW-Mini | 10,216 | - 2.7% | 99,344 | + 3.8% | |
Daimler AG | 6948 | + 10.9% | 57,420 | + 13.1% | |
Toyota UK | 6318 | + 28.9% | 56,368 | + 19.7% | |
Fiat Group & Chrysler-Jeep | 4841 | + 32.4% | 38,049 | + 7.1% | |
Jaguar-Land Rover | 4328 | + 40.6% | 37,510 | + 25.3% | |
Honda | 3619 | + 26.3% | 31,130 | + 7.8% | |
--- | ----- | ----- | ----- | ----- | ----- |
--- | Total | 143,884 | + 9.3% | 1,201,564 | + 3.5% |
Related From GoodCarBadCar.net
UK Auto Sales By Brand - August 2012
UK Auto Sales By Brand - June 2012
UK Auto Sales By Brand - July 2011
Top 10 Best-Selling Cars In The UK - March 2012


No comments:
Post a Comment