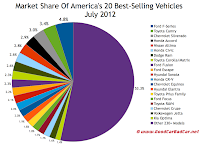
From just a bit more than 4% market share in June 2012, the Ford F-Series' total July 2012 volume pushed the pickup truck's market share up to just under 5% in July 2012. The F-Series finished July nearly 20,000 sales ahead of the Toyota Camry for overall sales leadership and leads the Camry by nearly 107,000 units through seven months.
In all, five pickups made their way onto this list of the 30 best-selling vehicles in the United States. Joining the trucks and the Camry are 14 more cars, one minivan, and nine SUVs and crossovers. 13 of the 30 most popular automobiles in America wore American badges.
Historical monthly and yearly sales figures for all these vehicles can be accessed through the first dropdown menu at GCBC's Sales Stats home or near the top right of this page. Key links to other best seller posts are visible at the bottom of this post. Click the accompanying market share chart for a look at how dominant the 20 top sellers are compared to the rest of the industry.
Source: Manufacturers
Red font indicates year-over-year declining sales
Related From GoodCarBadCar.net
Top 30 Best-Selling Vehicles In America - August 2012
Top 30 Best-Selling Vehicles In America - June 2012
U.S. Auto Sales By Brand - July 2012
Top 20 Best-Selling Cars In America - July 2012
Top 20 Best-Selling SUVs In America - July 2012
Top 5 Best-Selling Trucks In America - July 2012
Top 30 Best-Selling Luxury Vehicles In America - July 2012
All 261 Vehicles Ranked By U.S. July 2012 YTD Volume
In all, five pickups made their way onto this list of the 30 best-selling vehicles in the United States. Joining the trucks and the Camry are 14 more cars, one minivan, and nine SUVs and crossovers. 13 of the 30 most popular automobiles in America wore American badges.
Historical monthly and yearly sales figures for all these vehicles can be accessed through the first dropdown menu at GCBC's Sales Stats home or near the top right of this page. Key links to other best seller posts are visible at the bottom of this post. Click the accompanying market share chart for a look at how dominant the 20 top sellers are compared to the rest of the industry.
Rank | Vehicle | July 2012 | % Change | Year To Date | YTD % Change |
#1 | Ford F-Series | 49,314 | + 0.4% | 350,455 | + 11.9% |
#2 | Toyota Camry | 29,913 | + 10.7% | 243,816 | + 39.7% |
#3 | Chevrolet Silverado | 28,972 | - 12.5% | 223,480 | + 3.5% |
#4 | Honda Accord | 28,639 | + 70.2% | 183,817 | + 27.7% |
#5 | Nissan Altima | 26,602 | + 24.7% | 183,703 | + 19.9% |
#6 | Honda Civic | 24,526 | + 82.0% | 182,214 | + 34.6% |
#7 | Dodge Ram | 23,824 | + 17.3% | 162,405 | + 22.8% |
#8 | Toyota Corolla/Matrix | 23,640 | + 34.5% | 175,366 | + 13.6% |
#9 | Ford Fusion | 23,326 | + 20.7% | 160,175 | + 6.1% |
#10 | Ford Escape | 21,572 | - 11.6% | 148,739 | + 1.2% |
#11 | Hyundai Sonata | 20,978 | + 0.5% | 138,390 | + 1.8% |
#12 | Honda CR-V | 20,554 | + 47.4% | 167,236 | + 33.9% |
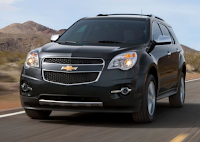
#13 | Chevrolet Equinox | 19,906 | + 16.5% | 130,796 | + 15.8% |
#14 | Hyundai Elantra | 18,512 | + 21.9% | 116,281 | - 1.9% |
#15 | Toyota Prius | 16,643 | + 111% | 143,297 | + 92.5% |
* Prius C | 3065 | ----- | 19,296 | ----- | |
* Prius V | 2954 | ----- | n/a | ----- | |
* Prius Plug-In | 688 | ----- | 5021 | ----- | |
#16 | Ford Focus | 16,454 | + 10.5% | 147,877 | + 31.0% |
#17 | Toyota RAV4 | 15,248 | + 73.0% | 104,686 | + 27.7% |
#18 | Chevrolet Cruze | 14,954 | - 39.3% | 128,838 | - 12.7% |
#19 | Volkswagen Jetta | 13,629 | - 13.3% | 96,832 | - 9.9% |
#20 | Kia Optima | 13,317 | + 96.6% | 86,475 | + 99.3% |
#21 | Nissan Rogue | 13,193 | + 17.2% | 85,031 | + 22.9% |
#22 | Chevrolet Malibu | 12,345 | - 36.8% | 153,782 | + 8.1% |
#23 | Jeep Wrangler | 12,216 | - 14.9% | 83,087 | + 22.9% |
#24 | Ford Explorer | 11,997 | + 21.2% | 89,891 | + 18.7% |
#25 | Honda Odyssey | 11,953 | + 88.8% | 73,709 | + 24.3% |
#26 | Jeep Grand Cherokee | 11,571 | + 21.8% | 86,688 | + 35.7% |
#27 | Toyota Tacoma | 11,350 | + 27.1% | 78,503 | + 27.0% |
#28 | GMC Sierra | 11,105 | - 11.8% | 84,050 | + 4.8% |
#29 | Toyota Highlander | 10,669 | + 11.7% | 68,113 | + 18.5% |
#30 | Kia Soul | 10,063 | - 0.7% | 73,698 | + 13.2% |
Red font indicates year-over-year declining sales
Related From GoodCarBadCar.net
Top 30 Best-Selling Vehicles In America - August 2012
Top 30 Best-Selling Vehicles In America - June 2012
U.S. Auto Sales By Brand - July 2012
Top 20 Best-Selling Cars In America - July 2012
Top 20 Best-Selling SUVs In America - July 2012
Top 5 Best-Selling Trucks In America - July 2012
Top 30 Best-Selling Luxury Vehicles In America - July 2012
All 261 Vehicles Ranked By U.S. July 2012 YTD Volume


No comments:
Post a Comment