 |
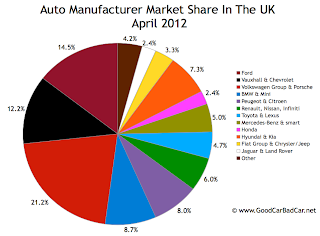
| Click Chart For A Larger View |
Volkswagen, for example, fell 16%. Renault, which recently shrunk the size of its lineup in the United Kingdom, plunged 56%. Alfa Romeo, Lexus, Mitsubishi, and Subaru slid 52%, 30%, 41%, and 38%, respectively.
On the other hand, sales at BMW and Mercedes-Benz shot up sharply. Toyota was also much improved compared with their April 2011 UK sales performance. Thanks in no small part to the Evoque, Land Rover sales jumped 54%. Jaguar sold 289 more cars this April than last. Honda sales jumped 20%, yet the world's foremost manufacturer of internal combustion engines still struggled to have much of an impact in the UK car market. Peugeot, Citroen, Hyundai, Kia, Skoda, and Fiat all sold cars more frequently than Honda last month.
Overall, the British new car market increased at a 3.3% clip in April. Sales were up 1.4% through the first four months of this year. The SMMT points out that UK car sales are still down substantially from 2007 but have risen significantly since 2009. 6% of the new vehicles sold so far this year have been Ford Fiestas. The Fiesta's market share in the United Kingdom is even more noteworthy than the dominating Ford F-Series' hold in the United States.
All brands competing for sales in the UK are ranked below by April 2012 volume. We published the UK's top 10 best-selling cars list a few hours ago.
Rank | Automaker | April 2012 | % Change | Year To Date | YTD % Change |
#1 | Ford | 20,621 | + 12.0% | 103,469 | + 5.1% |
#2 | Vauxhall | 16,487 | - 9.9% | 74,323 | - 12.6% |
#3 | Volkswagen | 13,300 | - 15.9% | 63,173 | + 1.1% |
#4 | BMW | 9846 | + 22.9% | 39,909 | + 4.2% |
#5 | Audi | 8991 | - 3.5% | 44,953 | + 6.7% |
#6 | Mercedes-Benz | 6721 | + 19.8% | 32,297 | + 14.4% |
#7 | Nissan | 6356 | - 9.3% | 36,437 | + 13.8% |
#8 | Toyota | 6191 | + 35.1% | 31,951 | + 13.0% |
#9 | Peugeot | 6125 | + 4.7% | 35,536 | + 3.5% |
#10 | Citroen | 5325 | + 26.0% | 24,910 | + 0.6% |
#11 | Hyundai | 5271 | + 14.3% | 23,032 | + 4.9% |
#12 | Kia | 5120 | + 40.6% | 22,331 | + 22.0% |
#13 | Skoda | 4039 | + 16.0% | 17,917 | + 22.3% |
#14 | Fiat | 3675 | + 25.0% | 16,734 | + 9.5% |
#15 | Honda | 3413 | + 19.6% | 18,160 | - 8.7% |
#16 | Seat | 3002 | + 18.4% | 13,086 | + 0.6% |
#17 | Land Rover | 2633 | + 53.8% | 18,443 | + 23.2% |
#18 | Volvo | 2627 | + 14.1% | 11,502 | - 2.1% |
#19 | Mini | 2581 | + 10.5% | 13,887 | - 3.8% |
#20 | Renault | 2081 | - 56.0% | 13,662 | - 45.6% |
#21 | Mazda | 1348 | - 15.2% | 11,056 | - 8.2% |
#22 | Suzuki | 1033 | - 7.6% | 8744 | + 9.6% |
#23 | Chevrolet | 910 | - 15.0% | 6192 | + 28.1% |
#24 | Jaguar | 805 | + 56.0% | 4825 | + 6.0% |
#25 | Porsche | 699 | + 44.1% | 2427 | + 32.0% |
#26 | Alfa Romeo | 637 | - 51.5% | 2946 | - 34.0% |
#27 | Lexus | 551 | - 29.8% | 3243 | + 6.0% |
#28 | Mitsubishi | 436 | - 40.9% | 2538 | - 41.1% |
#29 | smart | 378 | + 6.8% | 1866 | + 1.3% |
#30 | Chrysler | 217 | + 1106% | 999 | + 360% |
#31 | Jeep | 128 | - 14.7% | 810 | + 33.0% |
#32 | Infiniti | 103 | + 129% | 247 | + 79.0% |
#33 | Bentley | 92 | - 17.1% | 421 | + 15.7% |
#34 | Subaru | 83 | - 37.6% | 1003 | - 11.9% |
#35 | Ssangyong | 69 | + 3350% | 302 | + 3256% |
#36 | Aston Martin | 65 | - 35.0% | 368 | - 11.8% |
#37 | Abarth | 60 | - 44.4% | 422 | - 17.1% |
#38 | Perodua | 40 | - 21.6% | 175 | - 14.2% |
#39 | Proton | 27 | - 50.0% | 122 | - 42.2% |
#40 | Maserati | 26 | - 18.8% | 125 | - 11.4% |
#41 | Saab | 23 | - 95.3% | 137 | - 95.2% |
#42 | MG | 16 | + 45.5% | 462 | + 1493% |
#43 | Lotus | 8 | - 78.4% | 43 | - 74.7% |
Related From GoodCarBadCar.net
UK Auto Sales By Brand - May 2012
UK Auto Sales By Brand - March 2012
UK Auto Sales By Brand - February 2012
Top 10 Best-Selling Cars In The UK - April 2012
No comments:
Post a Comment