Exceeding what were high expectations, the U.S. auto industry collectively reported 1.3 million new vehicle sales in August 2012, up 20% from the same period a year earlier. Ford led the way with 188,608 sales. The top 16 brands all posted improved totals, year-over-year.
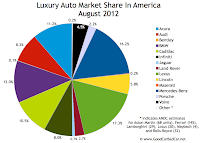
Lexus grabbed the luxury brand title for August, but Mercedes-Benz's leadership in the category, even without the Sprinter, was helped last month by BMW's brutal month. The new X1 delivered an extra 576 sales, but 5-Series sales slid 61% and the 3-Series was down 29%.
BMW's 19% decline was bested (worsted?) only by Mitsubishi's 47% slide. Mitsubishi's product lineup has been shrink-wrapped, now mainly consisting of the Outlander, Outlander Sport, and Lancer.
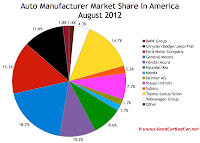
As a whole, General Motors improved 10%. Ford Motor Company was up 13% and is up 6% through the first eight months of 2012. Through eight months, Chrysler Group LLC is up 26%.
Honda, Acura, Volkswagen, Mini, Scion, and smart are the headline grabbers when it comes to year-over-year percentage increases. At the volume end, Honda and Volkswagen reported 57.9% and 62.5% improvements. Scion, with plenty of help from the new FR-S - an additional model in the family - jumped 112%.
August data from Canada has been posted elsewhere. By the end of the day you'll also be able to navigate through the first dropdown menu at GCBC's Sales Stats home in order to find historical and current sales results for every automobile currently on sale in America.
Later this afternoon we'll also be publishing lists of America's 20 best-selling cars from August in addition to the nation's 20 best-selling SUVs and crossovers and another for America's five best-selling pickup trucks.
First and foremost, you must check out this table ranking each and every brand by August U.S. sales volume.
U.S. Auto Sales By Brand - September 2012
U.S. Auto Sales By Brand - July 2012
U.S. Auto Sales By Brand - June 2012
U.S. Auto Sales By Brand - August 2011
Lexus grabbed the luxury brand title for August, but Mercedes-Benz's leadership in the category, even without the Sprinter, was helped last month by BMW's brutal month. The new X1 delivered an extra 576 sales, but 5-Series sales slid 61% and the 3-Series was down 29%.
 |
| August 2012 Auto Brand Market Share Click Either Chart For A Larger View |
BMW's 19% decline was bested (worsted?) only by Mitsubishi's 47% slide. Mitsubishi's product lineup has been shrink-wrapped, now mainly consisting of the Outlander, Outlander Sport, and Lancer.
As a whole, General Motors improved 10%. Ford Motor Company was up 13% and is up 6% through the first eight months of 2012. Through eight months, Chrysler Group LLC is up 26%.
Honda, Acura, Volkswagen, Mini, Scion, and smart are the headline grabbers when it comes to year-over-year percentage increases. At the volume end, Honda and Volkswagen reported 57.9% and 62.5% improvements. Scion, with plenty of help from the new FR-S - an additional model in the family - jumped 112%.
 |
| August 2012 Premium Auto Brand Market Share Chart |
August data from Canada has been posted elsewhere. By the end of the day you'll also be able to navigate through the first dropdown menu at GCBC's Sales Stats home in order to find historical and current sales results for every automobile currently on sale in America.
Later this afternoon we'll also be publishing lists of America's 20 best-selling cars from August in addition to the nation's 20 best-selling SUVs and crossovers and another for America's five best-selling pickup trucks.
First and foremost, you must check out this table ranking each and every brand by August U.S. sales volume.
Updated 11:37 AM AT 09.05.2012
Source: Automakers & ANDC
* Not including Lamborghini
Related From GoodCarBadCar.netRank | Automaker | August 2012 | % Change | Year To Date | YTD % Change |
#1 | Ford | 188,608 | + 13.1% | 1,453,536 | + 6.3% |
#2 | Chevrolet | 169,978 | + 11.3% | 1,270,582 | + 5.3% |
#3 | Toyota | 156,561 | + 45.3% | 1,199,163 | + 30.5% |
#4 | Honda | 115,675 | + 57.9% | 847,840 | + 22.7% |
#5 | Nissan | 87,360 | + 5.9% | 698,026 | + 13.1% |
#6 | Hyundai | 61,099 | + 4.4% | 479,789 | + 8.8% |
#7 | Kia | 50,028 | + 21.5% | 386,809 | + 16.6% |
#8 | Dodge | 47,348 | + 13.2% | 344,556 | + 12.8% |
#9 | Jeep | 42,839 | + 5.5% | 325,945 | + 21.5% |
#10 | Volkswagen | 41,011 | + 62.5% | 286,750 | + 37.6% |
#11 | GMC | 37,838 | + 3.7% | 273,366 | + 4.4% |
#12 | Subaru | 28,293 | + 35.8% | 217,780 | + 24.7% |
#13 | Chrysler | 28,070 | + 24.8% | 216,616 | + 61.7% |
#14 | Ram | 26,065 | + 18.0% | 192,946 | + 18.1% |
#15 | Lexus | 24,237 | + 33.9% | 150,604 | + 24.8% |
#16 | Mercedes-Benz | 22,686 | + 11.6% | 182,070 | + 14.5% |
#17 | Mazda | 22,234 | - 1.8% | 185,349 | + 11.8% |
#18 | Buick | 18,000 | + 12.4% | 122,589 | - 3.1% |
#19 | BMW | 16,835 | - 19.1% | 164,636 | + 5.6% |
#20 | Acura | 15,646 | + 72.8% | 101,407 | + 28.1% |
#21 | Cadillac | 14,704 | + 11.3% | 90,933 | - 9.5% |
#22 | Audi | 11,527 | + 13.0% | 88,392 | + 17.5% |
#23 | Infiniti | 11,155 | + 23.6% | 77,551 | + 21.7% |
#24 | Lincoln | 8141 | + 1.7% | 57,078 | - 1.3% |
#25 | Scion | 7722 | + 112% | 49,747 | + 47.3% |
#26 | Volvo | 6323 | + 21.2% | 46,653 | - 1.0% |
#27 | Mini | 5718 | + 83.9% | 43,632 | + 15.9% |
#28 | Mitsubishi | 4249 | - 46.8% | 41,316 | - 31.2% |
#29 | Fiat | 4150 | + 33.6% | 28,566 | + 158% |
#30 | Land Rover | 3727 | + 32.8% | 28,038 | + 22.4% |
#31 | Porsche | 3026 | + 38.6% | 22,279 | + 8.7% |
#32 | Suzuki | 1968 | - 18.3% | 17,228 | - 5.6% |
#33 | Jaguar | 1029 | + 27.0% | 8546 | + 4.2% |
#34 | smart | 753 | + 85.9% | 6281 | + 44.2% |
#35 | Maserati | 219 | + 3.8% | 1715 | + 13.8% |
#36 | Bentley | 156 | + 25.8% | 1405 | + 26.7% |
--- | ----- | ----- | ----- | ----- | ----- |
----- | General Motors | 240,520 | + 10.1% | 1,757,470 | + 3.7% |
---- | Ford Motor Company | 196,749 | + 12.6% | 1,510,614 | + 6.0% |
---- | Toyota Motor Corporation | 188,520 | + 45.6% | 1,399,513 | + 30.4% |
---- | Chrysler Group | 148,472 | + 14.1% | 1,108,629 | + 25.7% |
---- | American Honda | 131,321 | + 59.5% | 949,247 | + 22.6% |
---- | Hyundai-Kia | 111,127 | + 11.5% | 866,598 | + 12.2% |
---- | Nissan USA | 98,515 | + 7.6% | 774,577 | + 13.7% |
--- | Volkswagen Group * | 55,720 | + 47.6% | 398,826 | + 30.6% |
---- | Daimler AG | 23,439 | + 13.1% | 188,351 | + 17.9% |
--- | BMW-Mini | 22,553 | - 5.7% | 208,268 | + 7.6% |
---- | Jaguar-Land Rover | 4756 | + 31.5% | 36,584 | + 17.6% |
--- | ----- | ----- | ----- | ----- | ----- |
--- | Total | 1,261,849 | + 20.0% | 9,522,848 | + 14.7% |
* Not including Lamborghini
U.S. Auto Sales By Brand - September 2012
U.S. Auto Sales By Brand - July 2012
U.S. Auto Sales By Brand - June 2012
U.S. Auto Sales By Brand - August 2011

No comments:
Post a Comment