 |
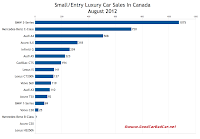
| Small/Entry Luxury Car Sales Chart Click Either Chart For A Larger View |
In many cases, the MKZ's in particular, there are perfectly understandable reasons for these declines. Consider model year changeovers, full model replacements, and models being extinguished. But among cars shown in the tables which are visible after the jump and in the accompanying charts (which now include the Audi A5 - you can click charts for a larger view) only ten reported year-over-year increases. Ford F-Series sales increased by 2389 units in August; the overall market's boost totalled 8989 units.
 |
| Midsize Luxury Car Sales Chart |
Lexus sold 88 GS sedans in August, seven were GS450h hybrids. Lexus also sold 285 ES sedans, 22 were ES300h hybrids. Sales of BMW's 5-Series; Audi's A4, A5, A6, and A7; Acura's TL; the luxury-leading Mercedes-Benz C-Class; and BMW's second-ranked 3-Series all posted gains compared with August 2011.
Want to go back in time? As always, historical monthly and yearly sales figures for any vehicle currently marketed in North America can be accessed through the first dropdown menu at GCBC's Sales Stats home or, for non-mobile users, near the top right of this page. But we've added links in the tables below which will take you directly to each vehicle's sales page. Just click the model name. That'll save you a couple steps.
Small/Entry Luxury Car | August 2012 | % Change | Year To Date | YTD % Change |
----- | - 100% | 26 | - 98.0% | |
318 | ----- | 764 | ----- | |
92 | - 4.2% | 888 | + 17.6% | |
110 | - 6.8% | 1049 | + 20.4% | |
508 | + 13.6% | 4047 | + 6.2% | |
223 | + 68.9% | 1405 | - 6.0% | |
69 | - 43.9% | 806 | - 33.1% | |
1075 | + 13.3% | 6897 | - 12.3% | |
194 | - 39.4% | 1682 | - 26.8% | |
259 | - 24.0% | 2286 | - 5.0% | |
137 | - 24.7% | 1112 | + 39.7% | |
----- | - 100% | 108 | - 56.6% | |
141 | - 45.6% | 1356 | - 10.2% | |
1 | - 99.4% | 2 | - 99.9% | |
720 | + 13.7% | 7325 | + 26.1% | |
----- | - 100% | 15 | - 83.3% | |
25 | - 63.8% | 519 | + 1.4% | |
119 | - 10.5% | 1197 | + 19.6% |
Midsize Luxury Car | August 2012 | % Change | Year To Date | YTD % Change |
1 | - 66.7% | 19 | - 56.8% | |
262 | + 67.9% | 2292 | + 40.4% | |
73 | + 10.6% | 632 | + 87.5% | |
85 | + 26.9% | 592 | + 51.8% | |
212 | + 19.1% | 1875 | + 2.5% | |
48 | ----- | 58 | ----- | |
7 | - 30.0% | 80 | + 5.3% | |
95 | - 5.0% | 847 | + 70.1% | |
19 | - 38.7% | 196 | - 27.9% | |
22 | - 37.1% | 261 | - 7.1% | |
285 | + 50.8% | 1210 | - 6.4% | |
88 | + 700% | 685 | + 637% | |
27 | - 22.9% | 405 | - 7.7% | |
37 | - 71.1% | 714 | - 40.2% | |
381 | - 5.9% | 2891 | + 15.0% | |
----- | - 100% | 6 | - 85.7% | |
2 | - 77.8% | 172 | - 41.1% | |
48 | - 47.3% | 556 | - 5.6% |
Related From GoodCarBadCar.net
Small/Entry & Midsize Luxury Car Sales In Canada - September 2012
Small/Entry & Midsize Luxury Car Sales In Canada - July 2012
Small/Entry & Midsize Luxury Car Sales In Canada - August 2011
Top 30 Best-Selling Luxury Vehicles In Canada - August 2012
Small & Midsize Luxury SUV Sales In Canada - August 2012
Canada Auto Sales Brand Rankings - August 2012
Sporty & Premium Sporty Car Sales In Canada - August 2012

No comments:
Post a Comment