 |
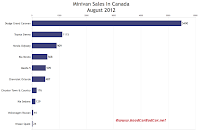
| Minivan Sales Chart Click Either Chart For Larger View |
While we're on the subject of Windsor-built minivans, Volkswagen sold 44 Routans in August. That's down from 53 a year earlier. Think that's low? Well... yeah, it is. During the same period, however, Nissan Quest sales plunged from 103 to just 24.
Not unlike the minivan segment, Canada's pickup truck category is dominated by one vehicle. Like the minivan segment, there are other relevant products and many ultra-low volume nameplates. 41% of the trucks sold were Ford F-Series pickups. The GM's twins and the Ram P/U accounted for another 47.5% of the trucks sold.
 |
| Pickup Truck Sales Chart |
Want to go back in time? As always, historical monthly and yearly sales figures for any vehicle currently marketed in North America can be accessed through the first dropdown menu at GCBC's Sales Stats home or, for non-mobile users, near the top right of this page. But we've added links in the tables below which will take you directly to each vehicle's sales page. Just click the model name. That'll save you a couple steps.
After the jump you'll find detailed August and year-to-date data on ten vans and 15 trucks, including the defunct Dodge Dakota.
Minivan | August 2012 | % Change | Year To Date | YTD % Change |
487 | ----- | 4121 | ----- | |
176 | 0.0% | 3280 | + 3.2% | |
5490 | + 0.4% | 38,778 | - 2.5% | |
909 | + 59.5% | 6285 | + 13.1% | |
568 | + 9.9% | 3396 | - 28.8% | |
129 | + 19.4% | 579 | - 42.3% | |
509 | + 31.9% | 3882 | - 15.4% | |
24 | - 76.7% | 510 | - 13.0% | |
1115 | + 7.7% | 8406 | + 14.7% | |
44 | - 17.0% | 436 | - 30.8% |
Truck | August 2012 | % Change | Year To Date | YTD % Change |
15 | - 16.7% | 110 | - 18.5% | |
359 | - 5.5% | 2415 | - 0.9% | |
99 | - 59.6% | 1293 | - 30.4% | |
3792 | + 2.5% | 24,966 | - 5.5% | |
Dodge Dakota | ----- | - 100% | 45 | - 96.6% |
5575 | + 4.5% | 47,515 | + 12.4% | |
11,580 | + 26.0% | 74,362 | + 15.1% | |
120 | - 93.3% | 3515 | - 69.0% | |
87 | - 54.5% | 1160 | - 27.8% | |
3990 | - 13.2% | 30,100 | - 1.8% | |
204 | + 29.1% | 1329 | + 34.4% | |
267 | - 24.4% | 1977 | + 11.8% | |
397 | + 2.8% | 2263 | + 28.4% | |
839 | + 31.1% | 6165 | + 25.1% | |
796 | + 49.3% | 4863 | + 8.1% |
Related From GoodCarBadCar.net
Minivan & Truck Sales In Canada - September 2012
Canada Minivan & Truck Sales - July 2012
Canada Minivan & Truck Sales - August 2011
Top 5 Best-Selling Trucks In Canada - August 2012
Top 30 Best-Selling Vehicles In Canada - August 2012
Canada Auto Sales Brand Rankings - August 2012
Commercial Van Sales In Canada - August 2012

No comments:
Post a Comment