 |
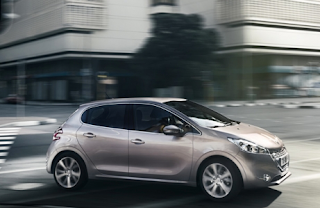
| Peugeot's New 208 |
Hyundai outsold Kia by 25 units. Peugeot outlasted its Citroen partner by 548 sales. Audi remains the premium brand leader, now 3842 sales ahead of BMW through eight months.
Just under 60,000 new vehicles were registered in the UK in August 2012, a very slight increase over August 2011. The UK's three best-selling brands did their best to bring the overall industry down. Audi, Peugeot, Nissan, Mercedes-Benz, Hyundai, and Kia were the biggest brands to have posted year-over-year gains.
Rank | Automaker | August 2012 | % Change | Year To Date | YTD % Change |
#1 | Ford | 8094 | - 5.4% | 176,999 | + 3.3% |
#2 | Vauxhall | 6878 | - 1.5% | 140,809 | - 6.5% |
#3 | Volkswagen | 6056 | - 2.9% | 115,296 | + 1.0% |
#4 | Audi | 4008 | + 6.2% | 79,107 | + 7.3% |
#5 | BMW | 3449 | - 10.9% | 75,265 | + 3.8% |
#6 | Peugeot | 3421 | + 8.6% | 63,045 | + 3.4% |
#7 | Citroen | 2873 | - 1.1% | 45,547 | + 4.9% |
#8 | Nissan | 2830 | + 6.8% | 65,120 | + 11.1% |
#9 | Mercedes-Benz | 2378 | + 10.8% | 56,783 | + 14.0% |
#10 | Hyundai | 2245 | + 11.4% | 42,639 | + 13.6% |
#11 | Kia | 2220 | + 24.9% | 41,291 | + 23.2% |
#12 | Toyota | 1983 | - 9.9% | 53,022 | + 17.6% |
#13 | Skoda | 1728 | - 0.8% | 34,042 | + 16.0% |
#14 | Fiat | 1555 | + 10.9% | 30,752 | + 13.2% |
#15 | Honda | 1412 | + 43.4% | 32,542 | + 8.9% |
#16 | Mini | 1189 | - 15.0% | 28,717 | + 0.9% |
#17 | Seat | 1130 | + 10.6% | 22,704 | + 2.0% |
#18 | Renault | 1086 | - 34.5% | 23,208 | - 44.9% |
#19 | Suzuki | 948 | + 50.5% | 15,114 | + 21.9% |
#20 | Mazda | 902 | - 3.0% | 17,761 | - 11.0% |
#21 | Volvo | 612 | - 5.8% | 19,925 | - 3.6% |
#22 | Land Rover | 591 | + 55.1% | 30,102 | + 34.1% |
#23 | Chevrolet | 353 | - 27.8% | 10,010 | + 18.8% |
#24 | Alfa Romeo | 234 | - 29.9% | 4888 | - 35.0% |
#25 | Lexus | 197 | + 48.1% | 5526 | + 21.2% |
#26 | Porsche | 194 | - 1.5% | 4835 | + 32.4% |
#27 | Jaguar | 178 | - 5.3% | 8177 | + 1.7% |
#28 | smart | 139 | - 7.3% | 3154 | - 3.3% |
#29 | Mitsubishi | 118 | - 38.2% | 3986 | - 41.3% |
#30 | Chrysler | 109 | + 39.7% | 2137 | + 381% |
#31 | Jeep | 51 | + 27.5% | 1359 | + 10.8% |
#32 | Subaru | 32 | - 5.9% | 1396 | - 12.8% |
#33 | Bentley | 28 | - 22.2% | 809 | + 13.0% |
#34 | Aston Martin | 26 | - 42.2% | 575 | - 19.0% |
#35 | Ssangyong | 20 | + 1900% | 524 | + 4664% |
#36 | Abarth | 15 | - 60.5% | 691 | - 15.5% |
T37 | Infiniti | 13 | 0.0% | 342 | + 69.3% |
T37 | Maserati | 13 | 0.0% | 199 | - 26.3% |
T39 | Perodua | 11 | - 64.5% | 283 | - 25.1% |
T39 | Proton | 11 | - 50.0% | 185 | - 44.4% |
#41 | Saab | 7 | - 92.4% | 207 | - 94.5% |
#42 | MG | 6 | - 71.4% | 559 | + 204% |
#43 | Lotus | 4 | - 55.6% | 103 | - 62.1% |
--- | ----- | ----- | ----- | ----- | ----- |
Volkswagen Group | 13,144 | + 1.0% | 256,793 | + 5.3% | |
Ford Motor Company | 8094 | - 5.4% | 176,999 | + 3.3% | |
General Motors | 7231 | - 3.2% | 150,819 | - 5.2% | |
PSA (Peugeot & Citroen) | 6294 | + 4.0% | 108,592 | + 4.0% | |
RNA (Renault, Nissan & Infiniti) | 3929 | - 9.1% | 88,670 | - 12.1% | |
Hyundai-Kia | 4465 | + 17.7% | 83,930 | + 18.1% | |
BMW-Mini | 4638 | - 12.0% | 103,982 | + 3.0% | |
Daimler AG | 2517 | + 9.6% | 59,937 | + 13.0% | |
Toyota UK | 2180 | - 6.6% | 58,548 | + 17.9% | |
Fiat Group & Chrysler-Jeep | 1977 | + 3.8% | 40,026 | + 6.9% | |
Jaguar-Land Rover | 769 | + 35.1% | 38,279 | + 25.5% | |
Honda | 1412 | + 43.4% | 32,542 | + 8.9% | |
--- | ----- | ----- | ----- | ----- | ----- |
--- | Total | 59,433 | + 0.1% | 1,260,997 | + 3.3% |
Related From GoodCarBadCar.net
United Kingdom Auto Sales By Brand - September 2012
UK Auto Sales By Brand - July 2012
UK Auto Sales By Brand - August 2011
Top 10 Best-Selling Cars In The UK - August 2012
Canada Auto Sales By Brand - August 2012
U.S. Auto Sales By Brand - August 2012
No comments:
Post a Comment