 |
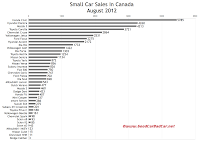
| Small Car Sales Chart Click Any Chart For Larger View |
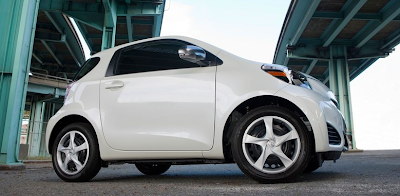
So Toyota can't sell small cars in Canada? Er... no. Toyota can't sell small cars named Scion in Canada, that's all.
 |
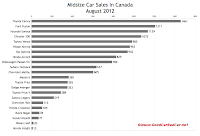
| Midsize Car Sales Chart |
August was Dodge's first meaningful Dart sales month. We can expect Dart sales to rise dramatically from current levels. Until then, car sales at Chrysler Canada are dominated by the 200/Avenger tandem, sales of which totalled 1428 in August. That's not as many buyers as Toyota found with the Camry, but it's more than any other single midsize car in Canada. Alone, the Chrysler 200 sold 1075 times. Does its $16,395 base price help produce such output? Yup, it do. Honda's outgoing 2012 Accord sedan has a base price of $24,890, for example.
Chrysler Canada also sold 508 copies of the company's full-size sedan twins, the Charger and 300. That's next to nothing in comparison to Canada's volume leaders. Honda sold 5785 Civics in August, for example. Meanwhile Canadians only registered 1850 new large cars in total last month, the large car segment being defined as the eight cars shown in the accompanying chart and the table below.
 |
| Large Car Sales Chart |
Want to go back in time? As always, historical monthly and yearly sales figures for any vehicle currently marketed in North America can be accessed through the first dropdown menu at GCBC's Sales Stats home or, for non-mobile users, near the top right of this page. But we've added links in the tables below which will take you directly to each vehicle's sales page. Just click the model name. That'll save you a couple steps.
After the jump you'll find detailed sales info on a barrel full of small cars, nearly two dozen midsize cars, and the eight aforementioned large cars. The iQ, Dart, 200, and Civic form only a small part.
Small Car | August 2012 | % Change | Year To Date | YTD % Change |
477 | ----- | 3486 | ----- | |
2864 | - 14.9% | 22,319 | - 10.9% | |
11 | - 88.9% | 160 | - 83.3% | |
747 | - 16.7% | 6581 | + 31.5% | |
98 | ----- | 110 | ----- | |
3 | - 96.9% | 279 | - 93.5% | |
423 | ----- | 473 | ----- | |
750 | + 21.8% | 6436 | + 66.9% | |
702 | - 41.9% | 9172 | - 4.9% | |
2275 | - 29.5% | 19,301 | + 3.6% | |
5785 | + 88.3% | 42,412 | + 28.3% | |
407 | + 17.3% | 3198 | + 39.0% | |
2172 | + 0.9% | 17,780 | + 12.6% | |
4260 | + 9.6% | 34,164 | + 3.7% | |
1303 | + 13.9% | 11,003 | + 5.2% | |
1733 | + 319% | 9771 | + 106% | |
698 | - 48.2% | 5582 | - 31.9% | |
460 | - 48.7% | 3752 | - 44.7% | |
4213 | + 16.8% | 28,102 | + 9.5% | |
337 | + 14.2% | 3205 | + 32.2% | |
23 | ----- | 150 | ----- | |
543 | - 18.8% | 5000 | + 8.3% | |
15 | - 68.8% | 241 | - 18.9% | |
1134 | + 66.3% | 7794 | - 21.1% | |
856 | + 23.2% | 8772 | - 15.6% | |
85 | ----- | 663 | ----- | |
93 | - 33.6% | 771 | - 21.9% | |
43 | - 67.7% | 458 | - 46.6% | |
286 | + 120% | 1482 | + 14.6% | |
826 | + 91.6% | 7715 | + 41.4% | |
201 | ----- | 201 | ----- | |
275 | - 4.2% | 1948 | - 1.0% | |
3721 | + 19.7% | 28,770 | + 16.6% | |
1254 | - 2.2% | 9530 | + 0.8% | |
188 | ----- | 1936 | ----- | |
872 | - 9.1% | 7695 | + 53.5% | |
161 | + 16,000% | 1545 | + 684% | |
1422 | + 7.1% | 9396 | - 2.5% | |
2531 | + 16.3% | 17,013 | - 8.4% |
Midsize Car | August 2012 | % Change | Year To Date | YTD % Change |
78 | - 77.6% | 1334 | - 29.7% | |
605 | - 70.2% | 3661 | - 58.4% | |
113 | ----- | 713 | ----- | |
1075 | + 111% | 10,811 | + 116% | |
353 | + 137% | 3619 | - 1.6% | |
1211 | - 15.0% | 12,115 | - 13.7% | |
829 | - 13.2% | 5060 | - 12.2% | |
105 | + 5.0% | 650 | - 10.5% | |
13 | + 44.4% | 88 | - 60.0% | |
1139 | - 19.9% | 10,830 | - 8.6% | |
942 | + 524% | 8998 | + 934% | |
365 | - 4.7% | 2920 | + 15.3% | |
963 | + 68.1% | 9713 | + 1.9% | |
20 | + 122% | 180 | + 620% | |
219 | - 9.9% | 1719 | - 20.2% | |
637 | + 38.8% | 4591 | - 2.1% | |
71 | + 77.5% | 453 | - 14.2% | |
1461 | - 10.5% | 13,169 | + 73.3% | |
355 | + 438% | 2287 | + 96.8% | |
288 | ----- | 2906 | ----- | |
985 | - 16.2% | 7763 | - 3.3% | |
789 | + 267% | 5350 | + 331% |
Large Car | August 2012 | % Change | Year To Date | YTD % Change |
308 | + 2.0% | 1838 | - 14.4% | |
9 | - 94.7% | 547 | - 68.5% | |
702 | - 58.2% | 6235 | - 20.1% | |
289 | + 133% | 4595 | + 174% | |
219 | + 73.8% | 3102 | - 2.3% | |
207 | - 20.1% | 4068 | + 59.0% | |
81 | - 75.2% | 1696 | + 14.0% | |
35 | - 31.4% | 250 | - 16.9% |
Related From GoodCarBadCar.net
Small, Midsize & Large Car Sales In Canada - September 2012
Small, Midsize & Large Car Sales In Canada - July 2012
Small, Midsize & Large Car Sales In Canada - August 2011
Top 20 Best-Selling Cars In Canada - August 2012
Canada Auto Sales Brand Rankings - August 2012
Small, Midsize & Large SUV Sales In Canada - August 2012

No comments:
Post a Comment