Showing posts with label US Large SUV Sales. Show all posts
Wednesday, March 6, 2013

February 2013 Large SUV Sales In America

2013 Chevrolet Tahoe PPV
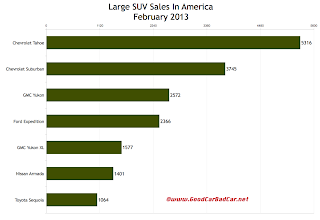
Americans - and the Secret Service - registered 18,041 full-size sport-utility vehicles in February 2013, not including the nameplates shown in the large luxury SUV sales chart yesterday. The segment was up 7.5% compared with February 2012, up 32% compared with January 2013. America's overall new vehicle market produced gains of 3.7% and 14.3% in the same periods.


U.S. large SUV sales chart February 2013
Click Chart For Larger View
America's three favourite large SUVs in February were all GM products. Ford Expedition sales fell 22.4%. The Nissan Armada was down 22.5%. 

Through the first two months of 2013, GM's market share rose to 69.4% (from 66%) in a segment that's grown 0.4% compared with last year. 

Click any model name in the table below to find historical monthly and yearly sales figures from both the United States and Canada.

Click Column Headers To Sort - January 2013's Edition - February 2013's Edition
SUV
February 
2013
%
Change
Year 
To 
Date
YTD
% Change
3745
+ 13.3%6037- 3.2%
5316
+ 26.2%8935+ 8.9%
2366
- 22.4%4858- 10.0%
2572
+ 21.0%4262+ 2.8%
1577
+ 26.8%2773+ 23.0%
1401
- 22.5%2599- 19.0%
1064
+ 2.3%2244+ 6.5%
Source: Manufacturers

RECOMMENDED READING
Large SUV Sales In America - January 2013
Large SUV Sales In America - February 2012
Top 20 Best-Selling SUVs & Crossovers In America - February 2013
U.S. Auto Sales Brand Rankings - February 2013
Thursday, February 7, 2013

January 2013 Large SUV Sales In America

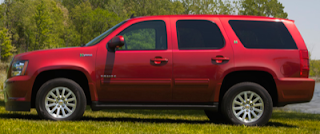
2013 Chevrolet Tahoe Hybrid Red
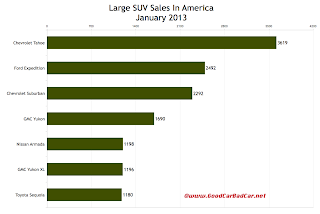
13,667 full-size mainstream brand sport-utility vehicles found homes in America in January 2013. That's down 7.5% from the 14,783 large SUVs sold in the U.S. a year ago, when the segment made up 1.6% of all new vehicle sales in America. These seven sport-utes accounted for just 1.3% last month. Americans, for business use and presumably even personal use, registered 18,487 commercial-oriented vans. 

The Chevrolet Tahoe, America's 15th-best-selling SUV in December, posted a 9% year-over-year decline and a 58% month-over-month slide even as the market rose 14% year-over-year and slid just 23% from December to January. 


U.S. January 2013 large SUV sales chart
Click Chart For Larger View
Nevertheless, the Tahoe was still the top-selling large SUV in America last month, 1127 sales ahead of the Ford Expedition, sales of which rose 6% compared with last January. Moreoever, General Motors owned 64% of the increasingly unimportant category, down from 67% at this time last year.

The table below is now sortable by column. You can arrange vehicles by total volume, year-over-year change, or re-sort them alphabetically. Historical monthly and yearly sales figures for these vehicles can be accessed by clicking on the model name. You can find sales figures for any model by making a selection at GCBC's Sales Stats page or, for non-mobile users, by making a selection near the top right of this page.

Click Column Headers To Sort
SUV
January 2013
%
Change
Year To Date
YTD
% Change
2292
- 21.9%2292- 21.9%
3619
- 9.4%3619- 9.4%
2492
+ 6.0%2492+ 6.0%
1690
- 16.4%1690- 16.4%
1196
+ 18.3%1196+ 18.3%
1198
- 14.6%1198- 14.6%
1180
+ 10.5%1180+ 10.5%
Source: Manufacturers & ANDC

Related From GoodCarBadCar.net
Large SUV Sales In America - February 2013
Large SUV Sales In America - December & 2012 Year End
Large SUV Sales In America - January 2012
U.S. Auto Sales Brand Rankings - January 2013
Small SUV Sales In America - January 2013
Midsize SUV Sales In America - January 2013
Wednesday, January 9, 2013

December 2012 And 2012 Year End Small, Midsize, And Large SUV Sales In America

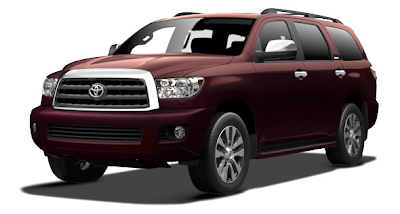
2013 Toyota Sequoia Sizzling Crimson
Rare Among Large SUVs In 2012, The Toyota Sequoia Posted A YOY Increase
2012 U.S. small SUV sales chart
2012 Small SUV Sales Chart
Click Any Chart For Larger View
Among smaller SUVs and crossovers competing for attention in the United States, no continuing vehicle suffered as great a decline as the Kia Sportage in 2012. Hyundai Santa Fe sales slid 4.5%, but Santa Fe sales have been rising of late. Kia Sorento sales slid 8.2% the year after it reached an all-time high in U.S. sales volume. The Mitsubishi Outlander was down 21%, but that's Mitsubishi, and we basically assume that sales will fall. The Honda Element, Suzuki Grand Vitara, Mazda CX-7, Mazda Tribute, and Suzuki Grand Vitara are dead, dying, or gone.

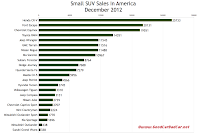
December 2012 U.S. small SUV sales chart
December 2012 Small SUV Sales Chart
The Sportage is certainly hindered by the Sorento's price proximity, but the bigger story is that the overall Kia brand's continued ascension occurs without the support of crossovers in a market where small crossovers are very, very popular. Keep in mind, this isn't a commentary on the popularity of the Sportage or the Sorento - Kia sold nearly 120,000 copies of the latter in 2012. But the decline of these two products, in addition to the extinguished Borrego, didn't hold Kia back from recording a 15% year-over-year increase in U.S. sales in 2012. In other words, Kia's car business is rockin', up 36% in 2012, 51% in 2011, 4% in 2010, and 18% in 2009. And even when the new vehicle market was in tatters, Kia car sales rose 0.2% in 2008.


2012 U.S. midsize SUV sales chart
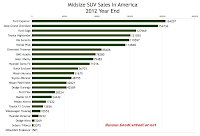
2012 Midsize SUV Sales Chart
This is an SUV sales segment breakdown post, however. Returning to the subject, the Honda CR-V had a tremendous year, selling more often in 2012 than in any other year in its history. The CR-V was the best-selling SUV or crossover in the United States in 2012, outselling the Ford Escape by 20,644 units.

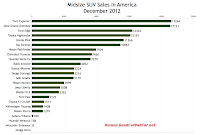
Scanning the lists of larger and/or more expensive midsize and large SUVs reveals a far greater amount of red ink, the kind of colouration that signifies declining year-over-year sales. From obvious candidates like the Subaru Tribeca and Mitsubishi Endeavor to popular vehicles like the Buick Enclave, Chevrolet Traverse, and GMC Acadia, many big crossovers struggled to find as many buyers in 2012 as they did in 2011. The same can't be said of the best sellers, however. Sales of the Ford Explorer rose 21%, as did sales of Jeep's Grand Cherokee. The Nissan Pathfinder, Toyota Highlander, and Volkswagen Touareg all posted increases better than that which was achieved by the overall new vehicle market.

December 2012 U.S. midsize SUV sales chart
December 2012 Midsize SUV Sales Chart
Very little went right with the biggest mainstream brand sport-utility vehicles, though. One vehicle, the least popular Toyota Sequoia, recorded a slim 1% improvement in sales, equal to 129 extra units for Toyota over the course of 2012's twelve months. Six other full-size SUVs were a drag on the overall market's growth. The Chevrolet Tahoe, America's 21st-best-selling SUV, sucked away 11,623 sales from General Motors that it had provided the brand last year; the GMC Yukon another 6432.

U.S. December 2012 large SUV sales chart
December 2012 Large SUV Sales Chart
In all, 237,550 full-size, mainstream brand, large SUVs were sold in the United States in 2012. That was down 9.1% from 2011 levels. In 2011, the five Detroit brand SUVs recorded year-over-year increases.

As always, you can find historical monthly and yearly sales figures for any of these models by selecting a make and model at GCBC's Sales Stats home or just clicking their name in the tables below. The biggest change from last month's edition of this post is that the tables visible after the jump are now sortable. Click any heading to see SUVs listed by December volume, or year-over-year change, or whatever you like. Click the heading again to flip the order, and click the headings at the far left to return to the original order.
U.S. 2012 large SUV sales chart

SUV
December 2012
%
Change
2012
Year End
YTD
% Change
2707
+ 36.5%36,935+ 425%
19,551
+ 7.5%218,621+ 13.1%
7688
+ 63.2%79,563+ 44.3%
20,131
- 21.3%261,008+ 2.6%
11,516
+ 49.1%97,786+ 17.6%
25,733
+ 19.2%281,652+ 29.0%
-----
- 100%3- 99.97%
7279
+ 43.2%71,016- 4.5%
3745
- 16.0%48,878+ 3.5%
3131
- 26.4%40,235- 15.7%
4566
+ 3.8%62,010+ 13.5%
11,545
+ 1.1%141,669+ 15.7%
10,967
+ 2.9%119,597- 8.2%
1696
- 53.1%36,357- 23.4%
5956
-----43,319-----
-----
- 100%11,326- 68.2%
----
- 100%502- 81.4%
2224
+ 12.3%45,111+ 10.5%
638
- 32.4%7750- 20.8%
1770
+ 15.4%18,091+ 10.0%
2739
- 9.5%36,358+ 1.3%
11,488
- 6.5%142,349+ 14.3%
8764
+ 1.9%76,347+ 0.2%
338
- 28.2%4954- 0.5%
14,351
+ 1.7%171,877+ 30.0%
3310
+ 37.7%31,731+ 22.1%

SUV
December 2012
%
Change
2012
Year
End
YTD
% Change
6052
+ 8.9%56,703- 2.9%
7430
- 20.3%85,606- 20.1%
5216
+ 8.5%42,589- 17.6%
-----
- 100%3269- 86.6%
12,434
+ 3.0%127,969+ 5.1%
17,244
+ 24.3%164,207+ 21.0%
2172
- 3.6%28,224+ 2.9%
5179
- 29.6%78,280- 1.3%
11,366
- 2.4%114,848- 1.2%
7279
+ 43.2%71,016- 4.5%
58
- 89.3%8232- 10.0%
17,121
- 1.3%154,734+ 21.1%
3508
- 43.1%75,483+ 13.2%
10,967
+ 2.9%119,597- 8.2%
3353
- 20.3%24,442- 29.0%
8
- 95.2%501- 94.8%
3999
- 26.9%51,675- 3.6%
7939
+ 198%42,621+ 64.3%
1379
- 30.2%17,222- 5.5%
189
- 41.7%2075- 25.7%
5224
+ 18.7%48,755+ 10.0%
1511
+ 37.4%13,656+ 0.8%
12,191
+ 3.5%121,055+ 19.6%
1408
+ 26.1%10,553+ 40.1%

SUV
December 2012
%
Change
2012
Year
End
YTD
% Change
5956
+ 0.4%48,116- 2.7%
8602
+ 2.0%68,904- 14.4%
4061
- 3.6%38,062- 6.0%
3942
- 0.7%27,818- 18.8%
2929
- 7.7%23,427- 7.1%
2134
+ 9.0%18,072- 1.4%
1533
- 20.2%13,151+ 1.0%
Source: Manufacturers & ANDC

Related From GoodCarBadCar.net
Small SUV Sales In America - January 2013
Midsize SUV Sales In America - January 2013
Large SUV Sales In America - January 2013
Small, Midsize & Large SUV Sales In America - December & 2011 Year End
Small, Midsize & Large SUV Sales In America - November 2012
Top 25 Best-Selling SUVs In America - 2012 Year End
Top 20 Best-Selling SUVs In America - December 2011
U.S. Auto Sales Brand Rankings - December & 2012 Year End
Wednesday, December 12, 2012

November 2012 Small, Midsize, And Large SUV Sales In America

2013 Nissan Armada midnight garnet
U.S. November 2012 small SUV sales chart
Small SUV Sales Chart
Click Any Chart For Larger View
America's new vehicle market is up 13.9% in 2012. The light truck market, which includes anything from minivans to pickup trucks, is up 9.6%.

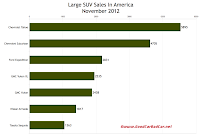
Don't thank full-size sport-utility vehicles for any of the industry's good fortunes this year. America's seven full-size, truck-based, mainstream brand SUVs found 231,688 buyers in the first eleven months of 2011 but only 208,393 in the first eleven months of 2012. That equals an 11.2% drop. Again, this didn't occur in a stagnant automobile market but in a thriving, growing, burgeoning market.


U.S. November 2012 midsize car sales chart
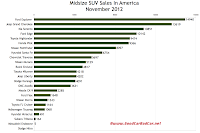
Midsize SUV Sales Chart
Only one of the seven nameplates in the category has posted a year-over-year gain through November 2012. That vehicle is the Toyota Sequoia, the worst-selling vehicle in the class. U.S. Sequoia sales are up 4.7% this year, equal to 518 extra sales. A proverbial drop in the bucket. The Toyota brand is up by 358,599 sales.

The worst large SUV declines? GMC Yukon sales are down 21.2%; 6406 lost sales. Its twin, the Chevrolet Tahoe, is down 16.4%, equal to 11,795 lost sales. You've heard about GM's scant 3.5% sales improvement this year? If we exclude the two big Chevy SUVs and two big GMCs from the conversation, General Motors sales are up 4.8% in 2012.

U.S. large SUV sales chart November 2012
Large SUV Sales Chart
As always, you can click any model name in the tables visible after the jump to see historical monthly and yearly sales figures. Or you can select any make or model at GCBC's Sales Stats home. Any SUV you can't find tabled here will be listed elsewhere - you can select from segments like small luxury SUVs and midsize cars at GCBC's The Tally page.

Click any of the three accompanying charts for a larger view. In those charts, SUVs are ranked by volume - they're listed alphabetically in the tables below.

Small SUV
November 2012
%
Change
Year To Date
YTD
% Change
3672
+ 26.0%34,228+ 577%
16,821
+ 12.6%199,070+ 13.7%
6569
+ 77.0%71,875+ 42.5%
20,970
- 3.9%240,877+ 5.3%
8158
+ 44.3%86,270+ 14.3%
22,333
+ 36.0%255,919+ 30.0%
6754
+ 10.2%63,737- 8.0%
3838
- 6.4%45,133+ 5.5%
2715
- 36.3%37,104- 14.6%
4174
+ 4.0%57,444+ 14.3%
10,337
+ 12.1%130,124+ 17.2%
10,851
+ 12.2%108,630- 9.2%
2269
- 29.5%34,661- 20.9%
4213
-----37,363-----
-----
- 100%11,327- 65.6%
1608
+ 13.9%18,788+ 27.8%
585
- 15.8%7112- 19.6%
1520
+ 34.2%16,321+ 9.5%
3003
+ 19.5%33,619+ 2.3%
12,662
+ 16.8%130,861+ 16.6%
5703
- 2.2%67,583- 0.02%
333
- 19.2%4616+ 2.4%
12,423
+ 9.6%157,526+ 33.3%
2815
+ 52.2%28,421+ 20.5%

Midsize SUV
November 2012
%
Change
Year To Date
YTD
% Change
4817
+ 22.8%50,651- 4.1%
5697
- 20.3%78,176- 20.1%
4091
+ 3.6%37,373- 20.3%
-----
- 100%3269- 85.4%
10,142
+ 4.7%115,535+ 5.4%
14,940
+ 15.9%146,963+ 20.6%
1648
- 23.8%26,052+ 3.5%
3631
- 25.7%73,101+ 1.6%
9366
- 10.7%103,482- 1.1%
6754
+ 10.2%63,737- 8.0%
491
- 51.8%8174- 5.0%
13,619
+ 0.5%137,613+ 24.7%
4202
- 19.2%71,975+ 18.9%
10,851
+ 12.2%108,630- 9.2%
2285
- 14.2%21,089- 30.2%
5
- 96.6%493- 94.8%
5129
+ 5.2%47,676- 1.0%
8097
+ 249%34,682+ 49.0%
1343
- 17.9%15,843- 2.5%
164
- 29.0%1886- 23.6%
4218
+ 14.1%43,531+ 9.1%
1164
+ 17.7%12,145- 2.4%
9474
+ 13.2%108,864+ 21.7%
1068
+ 27.1%9145+ 42.5%

Large SUV
November 2012
%
Change
Year To Date
YTD
% Change
4705
- 18.7%42,160- 3.1%
5895
- 29.8%60,302- 16.4%
2831
- 14.0%34,001- 6.3%
2438
- 18.4%23,876- 21.2%
2535
- 8.7%20,498- 7.0%
1817
+ 2.1%15,938- 2.7%
1363
+ 4.5%11,618+ 4.7%
Source: Manufacturers & ANDC

Related From GoodCarBadCar.net
Small, Midsize & Large SUV Sales In America - December & 2012 Year End
U.S. Small, Midsize & Large SUV Sales - October 2012
U.S. Small, Midsize & Large SUV Sales - November 2011
Top 20 Best-Selling SUVs In America - November 2012
U.S. Auto Sales Brand Rankings - November 2012