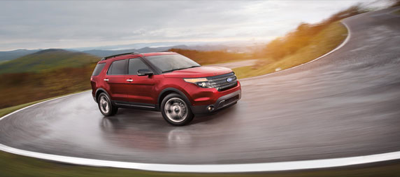
Assisted by 805 Police Interceptor Utility sales, the Ford Explorer recorded a 67% year-over-year U.S. sales increase in February 2013. Sales of the non-police Explorers rose 59% in February, and year-to-date, they're up 53% to 31,140.
Chief rivals are quite a ways behind. Jeep Grand Cherokee sales are down 12% this year. A new diesel engine option should provide a boost, as will other key updates. Sales of the Toyota Highlander are up 21%, but Explorer volume is 80% stronger. The Honda Pilot is 15,579 sales back of the Ford. And Ford's own two-row Edge is 13,301 units abaft.
The Explorer, America's fourth-best-selling SUV in America this year, is just 11,451 sales behind the best-selling Ford Escape in 2013. A year ago, the Explorer ranked seventh, 23,313 sales back of the top-selling Honda CR-V.
The nearly iconic Explorer was last America's best-selling SUV in 2006. It's unlikely that it'll rank at the top of the heap again - the least efficient Escape is 8.7% more efficient than the most efficient Explorer, and cheaper, too - but we wouldn't have expected sales of the fifth-gen Explorer to be rising so quickly in early 2013, either.
Historical monthly and yearly sales figures for all these vehicles can be accessed by clicking a model name in the sortable tables below or by making a selection at GCBC's Sales Stats page. Click any column header to re-sort the order of these tables, ranking vehicles by volume rather than listing them alphabetically, for instance. GoodCarBadCar published figures for smaller SUVs and crossovers earlier today. On the first day of March, this list of the best-selling SUVs was posted.
Click Column Headers To Sort - January 2013 Edition - February 2012 Edition
Source: Manufacturers & ANDC
* indicates a vehicle which is also shown in another GCBC segment breakdown
RECOMMENDED READING
Midsize SUV Sales In America - January 2013
Midsize SUV Sales In America - February 2012
Top 20 Best-Selling SUVs & Crossovers In America - February 2013
U.S. Auto Sales Brand Rankings - February 2013
Chief rivals are quite a ways behind. Jeep Grand Cherokee sales are down 12% this year. A new diesel engine option should provide a boost, as will other key updates. Sales of the Toyota Highlander are up 21%, but Explorer volume is 80% stronger. The Honda Pilot is 15,579 sales back of the Ford. And Ford's own two-row Edge is 13,301 units abaft.
 |
| Click Chart For Larger View |
The nearly iconic Explorer was last America's best-selling SUV in 2006. It's unlikely that it'll rank at the top of the heap again - the least efficient Escape is 8.7% more efficient than the most efficient Explorer, and cheaper, too - but we wouldn't have expected sales of the fifth-gen Explorer to be rising so quickly in early 2013, either.
Historical monthly and yearly sales figures for all these vehicles can be accessed by clicking a model name in the sortable tables below or by making a selection at GCBC's Sales Stats page. Click any column header to re-sort the order of these tables, ranking vehicles by volume rather than listing them alphabetically, for instance. GoodCarBadCar published figures for smaller SUVs and crossovers earlier today. On the first day of March, this list of the best-selling SUVs was posted.
Click Column Headers To Sort - January 2013 Edition - February 2012 Edition
SUV | February 2013 | % Change | Year To Date | YTD % Change |
|---|---|---|---|---|
5241 | + 25.8% | 10,136 | + 39.0% | |
8698 | + 9.2% | 15,468 | + 5.9% | |
4749 | + 38.3% | 8129 | + 25.9% | |
9683 | - 8.1% | 19,297 | + 2.4% | |
17,391 | + 66.6% | 32,598 | + 59.7% | |
1662 | - 17.4% | 3277 | - 5.8% | |
6628 | - 0.03% | 11,816 | + 2.7% | |
9614 | + 8.3% | 17,019 | + 11.6% | |
6339 | + 64.1% | 12,330 | + 42.0% | |
65 | - 85.6% | 97 | - 91.8% | |
9439 | - 25.8% | 20,504 | - 12.4% | |
1529 | - 79.3% | 3564 | - 74.9% | |
7945 | - 5.3% | 15,950 | + 1.5% | |
2594 | + 27.8% | 4710 | + 14.4% | |
5 | - 94.9% | 10 | - 94.8% | |
3987 | - 21.0% | 6983 | - 21.9% | |
7014 | + 146% | 13,295 | + 169% | |
194 | + 9.6% | 353 | - 12.8% | |
3979 | + 29.6% | 8464 | + 41.3% | |
9310 | + 14.1% | 18,141 | + 20.8% | |
836 | + 15.6% | 1798 | + 15.7% |
Tall Wagons & Crossovers | February 2013 | % Change | Year To Date | YTD % Change |
|---|---|---|---|---|
1234 | + 15.3% | 2507 | + 25.9% | |
9016 | + 2.9% | 17,648 | + 9.1% | |
3745 | + 40.2% | 7116 | + 38.7% |
Offroaders | February 2013 | % Change | Year To Date | YTD % Change |
|---|---|---|---|---|
10,091 | + 8.3% | 18,945 | + 10.0% | |
980 | - 32.7% | 1977 | - 32.2% | |
1355 | + 29.4% | 2587 | + 47.4% |
* indicates a vehicle which is also shown in another GCBC segment breakdown
RECOMMENDED READING
Midsize SUV Sales In America - January 2013
Midsize SUV Sales In America - February 2012
Top 20 Best-Selling SUVs & Crossovers In America - February 2013
U.S. Auto Sales Brand Rankings - February 2013

No comments:
Post a Comment