 |
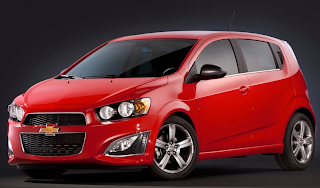
| Sales Of The Chevy Sonic, Like Many Other Subcompacts, Dropped In February 2013 |
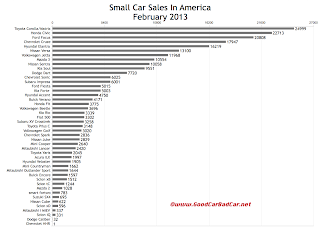
Dodge hadn't sold more than 7000 Calibers in any month since May 2010. Don't forget, some dealers also had a share in selling 3302 Fiat 500s.
Over at General Motors, Cruze sales took a dip. Chevrolet Sonic volume was down sharply, as well. The HHR's disappearance continues, as it has for months. At Buick, the Verano sold more than twice as often as the Acura ILX. For those who consider the Buick Encore a small car, we've linked it with other like-minded products, if like-minded is what they can be called. February was the Encore's second month, its first proper month on sale. Through the first two months of 2013, it's America's 164th-best-selling vehicle.
 |
| Click Chart For Larger View |
Suggestions as to how GCBC should break down segments in the future? Send'em on down. Historical monthly and yearly sales figures for any of these vehicles can be found by clicking a model name in the tables below, or by making a selection at GCBC's Sales Stats page. (Non-mobile users can also select a make and model near the top right of this page.) Nine of America's 20 best-selling cars in February are represented in this post.
Click Column Headers To Sort - January 2013 Edition - February 2012 Edition
Compact | February 2013 | % Change | Year To Date | YTD % Change |
|---|---|---|---|---|
1997 | ----- | 3555 | ----- | |
4171 | + 147% | 7831 | + 215% | |
17,947 | - 12.1% | 32,471 | - 8.5% | |
7720 | ----- | 14,874 | ----- | |
20,808 | - 10.9% | 39,969 | - 2.1% | |
22,713 | - 16.1% | 44,594 | - 8.9% | |
16,219 | + 17.4% | 28,393 | + 14.9% | |
5003 | - 12.3% | 9411 | - 7.0% | |
10,554 | - 6.4% | 18,628 | - 9.0% | |
2420 | + 66.8% | 4616 | + 87.1% | |
10,058 | - 5.2% | 19,037 | + 7.7% | |
6001 | - 17.3% | 11,897 | - 16.1% | |
695 | - 42.8% | 1521 | - 22.9% | |
24,999 | + 12.9% | 48,821 | + 21.6% | |
3020 | + 9.7% | 5669 | + 4.9% | |
11,968 | - 6.8% | 22,490 | - 5.5% |
Subcompact | February 2013 | % Change | Year To Date | YTD % Change |
|---|---|---|---|---|
6025 | - 23.7% | 13,202 | - 3.0% | |
5015 | - 9.1% | 9300 | + 3.1% | |
3775 | - 10.7% | 6931 | - 14.1% | |
4750 | - 18.2% | 8245 | - 18.7% | |
3339 | - 7.2% | 5809 | - 6.2% | |
1028 | - 61.9% | 2571 | - 55.1% | |
13,100 | + 28.6% | 23,370 | + 19.2% | |
3148 | + 15,640% | 5839 | + 29,095% | |
2045 | - 43.4% | 4942 | - 25.4% |
Tall Boxes & Crossovers | February 2013 | % Change | Year To Date | YTD % Change |
|---|---|---|---|---|
1597 | ----- | 1950 | ----- | |
1 | 0.0% | 2 | - 60.0% | |
32 | - 98.3% | 45 | - 98.5% | |
9551 | - 12.2% | 16,933 | - 10.7% | |
1662 | + 28.4% | 3078 | + 20.6% | |
1644 | + 19.6% | 2994 | + 20.1% | |
622 | - 9.5% | 1158 | + 0.9% | |
2829 | - 4.0% | 5190 | - 1.6% | |
1512 | - 6.1% | 2779 | - 1.1% | |
596 | - 27.1% | 1220 | - 17.0% | |
3258 | ----- | 6022 | ----- |
Small Car | February 2013 | % Change | Year To Date | YTD % Change |
|---|---|---|---|---|
2836 | ----- | 5244 | ----- | |
337 | + 666% | 594 | + 643% | |
331 | - 61.7% | 626 | - 49.4% | |
783 | + 1.8% | 1264 | - 0.1% |
Sporty Hatches | February 2013 | % Change | Year To Date | YTD % Change |
|---|---|---|---|---|
3302 | + 2.3% | 5805 | + 13.0% | |
1905 | - 41.2% | 3664 | - 25.7% | |
2640 | - 28.4% | 4906 | - 14.8% | |
Scion tC * | 1244 | - 24.6% | 2508 | - 15.2% |
3696 | + 184% | 5928 | + 119% |
* Indicates a model that is also shown in another GCBC segment breakdown
RECOMMENDED READING
Small Car Sales In America - January 2013
Small Car Sales In America - February 2012
Top 20 Best-Selling Cars In America - February 2013
U.S. Auto Sales Brand Rankings - February 2013
No comments:
Post a Comment