 |
| The Ford C-Max Has Been Able To Outsell The Toyota Prius V Without Too Much Trouble. The Original Prius Isn't So Easy To Knock Off Its Perch. |
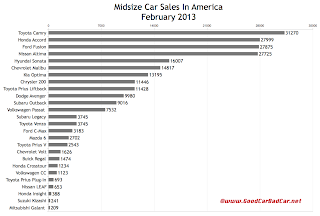
In other words, the Camry was way out in front, 7973 sales in front of the second-ranked Honda Accord and 20,645 sales ahead of the Optima.
Of the 158,888 sales sold by the same seven leading cars in February, the Camry was responsible for 20%, a three percentage point drop. The Optima's share was only a hair better. The Camry was just 3271 units ahead of the Accord in February. And the Accord's lead over the next two best-selling models, the Ford Fusion and Nissan Altima, shrunk to just 124 and 274 units, respectively.
 |
| Click Chart For Larger View |
Compare the Ford C-Max (which GoodCarBadCar is testing this week) with the Toyota Prius V if you must. It's quite a bit smaller and quite a bit more attractive. The Ford outsold the Prius V by 605 units in what was, for Toyota, a down month for its bigger Prii. The original Prius, however, still outsold the C-Max by a 3.6-to-1 count in February.
Historical monthly and yearly sales figures for all these vehicles can be found by clicking a model name in one of the tables below. You can also make a selection at GCBC's Sales Stats page. Nine of America's 20 best-selling passenger cars are represented in this post, total sales of which (excluding the not terribly Prius-derived Prius C) accounted for 19.4% of new vehicle sales in America in February 2013.
Click Column Headers To Sort - January 2013 Edition - February 2012 Edition
Midsize Car | February 2013 | % Change | Year To Date | YTD % Change |
|---|---|---|---|---|
1474 | - 44.1% | 2479 | - 44.8% | |
14,817 | - 25.9% | 30,640 | - 11.6% | |
11,446 | + 17.8% | 20,292 | + 21.3% | |
9980 | + 51.9% | 19,608 | + 59.8% | |
27,875 | + 28.0% | 50,274 | + 42.1% | |
27,999 | + 35.2% | 51,923 | + 51.1% | |
16,007 | - 8.1% | 29,254 | - 8.3% | |
13,195 | + 14.2% | 24,447 | + 20.0% | |
2702 | - 47.0% | 4849 | - 51.7% | |
209 | - 76.9% | 433 | - 83.5% | |
27,725 | - 15.9% | 49,189 | - 11.1% | |
3745 | + 3.6% | 6929 | + 2.9% | |
241 | - 61.2% | 527 | - 39.7% | |
31,270 | - 9.5% | 63,167 | + 0.5% | |
7532 | - 8.0% | 16,388 | + 13.0% | |
1123 | - 20.5% | 2315 | - 18.1% |
Midsize Hybrids & Electrics | February 2013 | % Change | Year To Date | YTD % Change |
|---|---|---|---|---|
1626 | + 58.9% | 2766 | + 70.1% | |
3183 | ----- | 5908 | ----- | |
388 | - 49.8% | 707 | - 44.1% | |
653 | + 36.6% | 1303 | + 12.9% | |
17,812 | - 13.5% | 33,584 | + 4.5% | |
11,428 | - 30.6% | 21,113 | - 15.4% | |
^ Toyota Prius C * | 3148 | + 15,640% | 5839 | + 29,095% |
2543 | - 37.7% | 5065 | - 29.0% | |
693 | + 3200% | 1567 | + 7362% |
Tall Wagons & Crossovers | February 2013 | % Change | Year To Date | YTD % Change |
|---|---|---|---|---|
1234 | + 15.3% | 2507 | + 25.9% | |
9016 | + 2.9% | 17,648 | + 9.1% | |
3745 | + 40.2% | 7116 | + 38.7% |
* Indicates a vehicle that is also displayed in another GCBC segment breakdown
^ Prius breakdown by variant
RECOMMENDED READING
Midsize Car Sales In America - January 2013
Midsize Car Sales In America - February 2012
Top 20 Best-Selling Cars In America - February 2013
U.S. Auto Sales Brand Rankings - February 2013
No comments:
Post a Comment