 |
| Mazda 5 Sales Are Surging, Relative To Historical Mazda 5 Sales |
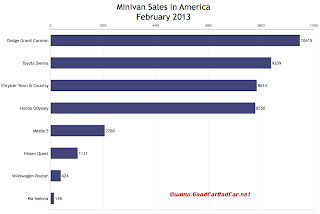
Of course, of the eight different minivan nameplates sold in the United States in February, two have or are in the process disappearing. If we exclude the Kia Sedona and Volkswagen Routan from the equation, America's minivan market still slid 4.9% in February. Minivans were responsible for just 3.4% of the industry's volume, down from 3.9% at this time last year.
There are three bits of good news on the minivan front, however. First, February wasn't nearly as bad as January. In the first month of 2013, minivans were responsible for just 2.8% of the industry's U.S. volume. Year-over-year minivan volume had slid 6.9%.
 |
| Click Chart For Larger View |
And for Toyota, the declines reported by the Chrysler Town & Country, Dodge Grand Caravan, and Honda Odyssey have paved the way for the Sienna to earn best seller status. Through two months, the Sienna has a narrow 1610-unit lead over the next-best-selling Grand Caravan, but that lead isn't as expansive as it was a month ago.
To find historical monthly and yearly sales figures for any of these minivans, click the model name in the table below. For any other vehicle, select a make and model at GCBC's Sales Stats page, or for non-mobile users, use the dropdown menu near the top right of this page. The U.S. minivan sales table below is now sortable, so you can arrange vehicles by February or year-to-date volume or by year-over-year change.
Click Column Headers To Sort
Minivan | February 2013 | % Change | Year To Date | YTD % Change |
|---|---|---|---|---|
8614 | - 10.5% | 15,139 | - 0.8% | |
10,415 | - 17.8% | 15,380 | - 25.9% | |
8550 | - 10.6% | 15,310 | - 7.0% | |
138 | - 90.8% | 501 | - 83.0% | |
2260 | + 48.8% | 4140 | + 54.2% | |
1131 | - 6.2% | 2109 | - 11.8% | |
9209 | + 20.3% | 16,990 | + 21.7% | |
424 | - 35.7% | 665 | - 58.9% |
RECOMMENDED READING
Minivan Sales In America - January 2013
Minivan Sales In America - February 2012
Top 30 Best-Selling Vehicles In America - February 2013
U.S. Auto Sales Brand Rankings - February 2013
No comments:
Post a Comment