Showing posts with label Canada Large SUV Sales. Show all posts
Wednesday, March 6, 2013

February 2013 Large SUV Sales In Canada

2013 Ford Expediton Limited Tuxedo Black
The Ford Expedition Wins
Because It Has Four Tailgates
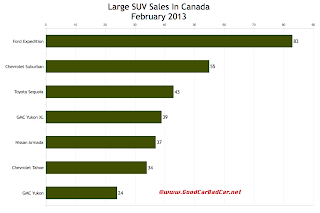
Canada's fledgling full-size SUV market plunged 45% in February 2013. Through two months, the market is down 35.9% compared with the same period in 2012; down 15.9% compared with 2011.

While this barely impacts the overall industry - only 259 fewer large SUVs were sold this February than last - it does manifest an exaggerated version of what's going on in the market as a whole. Sales are down slightly in other parts, mainly at import dealers. Chrysler Canada, Ford Canada, and GM Canada have all generated improvements this year.
All Vehicles Ranked By February 2013 & YTD Canadian Sales

Canada large SUV sales chart February 2013
Click Chart For Larger View
In the large SUV sector itself, GM owned 48.3% of the market in February, down from 50.1% in the month before and 57.7% a year ago. Keep in mind, segments this small are subject to huge percentage swings. The results rarely have a significant impact on their respective automaker's totals. Last February, for example, the large SUV market rose 31% even as the overall industry was up just 11.2%.

As always, click the model names in the table below to find historical monthly and yearly sales figures for all these nameplates, both the Canadian and U.S. figures.

The U.S. version of this chart was published just moments ago. Americans registered 57 times more large SUVs in February. The U.S. market was only 11.6 times stronger than the Canadian market last month.

Click Column Headers To Sort - January 2013 Edition - February 2013 Edition
SUV
February 
2013
%
Change
Year 
To 
Date
YTD
% Change
55
- 20.3%106- 26.4%
34
- 70.2%95- 57.6%
83
+ 10.7%205+ 10.8%
24
- 35.1%59- 47.8%
39
- 64.9%105- 50.9%
37
- 26.0%67- 34.3%
43
- 63.6%103- 40.1%
Source: Manufacturers

RECOMMENDED READING
Large SUV Sales In Canada - January 2013
Large SUV Sales In Canada - February 2012
Canada Auto Sales Brand Rankings - February 2013
Top 13 Best-Selling Trucks In Canada - February 2013
Top 20 Best-Selling SUVs And Crossovers In Canada - February 2013
Monday, February 18, 2013

January 2013 Large SUV Sales In Canada

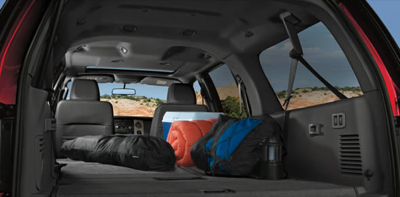
2013 Ford Expedition Max Cargo Area
This Partially Explains Why People Buy Full-Size, Truck-Based SUVs
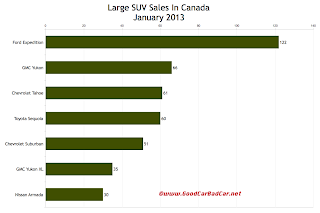
Canada January 2013 large SUv sales chart
Click Chart For Larger View
The seven mainstream full-size sport-utility vehicles available in Canada attracted 425 buyers in January 2013. That's 20 more sales than were collected by the seven SUVs in the large luxury category, a segment which includes much more costly nameplates. 

28.7% of the large SUVs sold in Canada last month were Ford Expeditions. 50.1% were GM products. Sales of all four GM SUVs (plus the Cadillac Escalade) declined by at least 32%. GMC Yukon XL sales were cut in half. The Toyota Sequoia outsold the Chevrolet Suburban and Yukon XL and nearly caught up to the Chevy Tahoe. Sequoia sales in the U.S. were relatively strong in January, as well.


As a group, these sport-utility vehicles were responsible for just 0.45% of the overall Canadian new vehicle market in January. Historical monthly and yearly sales figures for any of these SUVs can be found by clicking the model name in the sortable table below or by making a selection at GCBC's Sales Stats page.

Click Column Headers To Sort
SUV
January 
2013
%
Change
Year 
To Date
YTD
% Change
51
- 32.0%51- 32.0%
61
- 44.5%61- 44.5%
122
+ 10.9%122+ 10.9%
66
- 35.9%66- 35.9%
35
- 53.9%35- 53.9%
30
- 42.3%30- 42.3%
60
+ 11.1%60+ 11.1%
Source: Manufacturers & ANDC 
Red font indicates declining year-over-year sales

Related From GoodCarBadCar.net
Large SUV Sales In Canada - February 2013
Large SUV Sales In Canada - December & 2012 Year End
Large SUV Sales In Canada - January 2012
Top 20 Best-Selling SUVs In Canada - January 2013
Canada Auto Sales Brand Rankings - January 2013
Midsize SUV Sales In Canada - January 2013
Small SUV Sales In Canada - January 2013
Wednesday, January 23, 2013

December 2012 And 2012 Year End Midsize SUV Sales And Large SUV Sales In Canada

2013 Ford Expedition Red
Canada large SUV sales chart 2012 year end
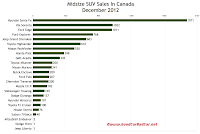
2012 Midsize SUV Sales Chart
Click Any Chart For Larger View
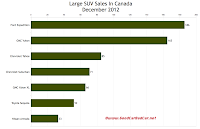
Canadians registered 658 new full-size mainstream brand sport-utility vehicles in December 2012. 59% of those SUVs were General Motors products, but the Ford Expedition was the class leader, outselling the GMC Yukon by 21 units.

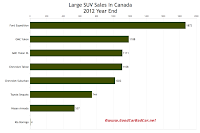
The Expedition was one of three full-size sport-utes to post a year-over-year volume increase in Canada in 2012. Compared with 2011, Expedition sales jumped 12%, good enough to beat the second-ranked GMC Yukon by 684 units. 7586 of these SUVs were sold in 2012, including the Kia Borrego's four units. GM owned 58% of the market, Ford another 25%, and the Asians the other 17%.


Canada December 2012 large SUV sales chart
December 2012 Midsize
SUV Sales Chart
But the large SUV category is an awfully small category in Canada. Numerous midsize utility vehicles - including the Hyundai Santa Fe and Kia Sorento, which GCBC also displays with small SUVs - outsold the whole large SUV segment with ease. Ford markets three different utility vehicles which outsell the Expedition and the Expedition's rivals combined.
Canada 2012 year end large SUV sales chart
2012 Large SUV Sales Chart

Speaking of Fords which outsell other SUVs, the Explorer beat the Jeep Grand Cherokee by eleven units. The Explorer also managed to outsell the Toyota 4Runner and Highlander, Toyota's midsize tandem, something it most definitely did not do south of the border.

Canada December 2012 large SUV sales chart
December 2012 Large
SUV Sales Chart
Ford is a much more popular brand as a whole in Canada. 14.9% of the new vehicles purchased and leased in the United States in 2012, but in Canada, the Ford brand's market share was 16.1%.  29.1% of the new Fords sold in Canada in 2012 were SUVs and crossovers. 24.7% of Ford Canada volume came from passenger cars; 39.4% of Ford volume was F-Series derived.

As always, you can find historical monthly and yearly sales figures for these SUVs and any other vehicle by selecting a make and model at GCBC's Sales Stats home or by clicking the model name in the tables below. Fortunately, the tables below are now sortable. Click the column headers in the tables to sort by December 2012 volume or 2012 year end volume or re-sort alphabetically.

Click On Column Headers To Sort
SUV
December 
2012
%
Change
2012
Year
End
YTD
% Change
209
- 27.2%3283- 11.2%
200
- 37.9%3333- 35.2%
137
- 51.8%2398- 5.9%
1
- 87.5%91- 80.4%
1011
- 10.7%18,837+ 20.5%
768
+ 17.1%10,427+ 10.9%
207
- 0.5%3268+ 14.2%
345
+ 1.8%4899- 5.9%
398
+ 18.8%5807+ 33.0%
1971
+ 108%23,394- 3.0%
101
- 16.5%1981+ 29.9%
683
- 28.1%10,416+ 1.3%
1
- 98.4%875- 55.1%
1022
+ 7.2%14,031- 7.1%
182
+ 40.0%1412+ 10.1%
2
- 96.7%114- 74.7%
241
- 46.6%4303- 11.5%
530
+ 279%2666+ 41.8%
76
+ 8.6%931- 26.0%
40
+ 33.3%390- 15.2%
250
+ 3.7%2878+ 11.6%
100
+ 58.7%726+ 13.6%
610
+ 20.8%6851+ 22.9%
149
+ 35.5%1975+ 22.1%

Monday, December 17, 2012

November 2012 Small, Midsize, And Large SUV Sales In Canada

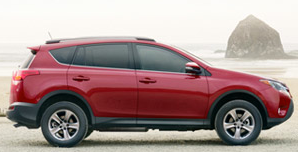
2013 Toyota RAV4 XLE red
Toyota's Recently Revamped 2013 Toyota RAV4
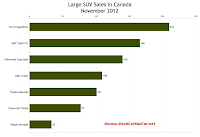
Sales of large, mainstream brand sport-utility vehicles are up 0.3% in November 2012. At first glance, this seems more than a little odd. 

As much as the North American new vehicle market has grown this year (up 6.5% through eleven months), growth in this category is not a matter of course. 

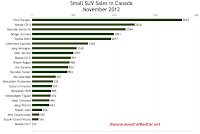
Canada November 2012 small suv sales chart
Small SUV Sales Chart
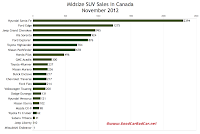
Click Any Chart For Larger View
U.S. new vehicle sales are up 14% through November, yet sales of these large SUVs are down 11% in America.

Four of the seven SUVs in the table at the bottom of this post have suffered year-over-year declines in 2012. The best-selling Ford Expedition is up 8%. The worst-selling Nissan Armada is down 9%. Twins behave similarly? Sales of the identical GMC Yukon and Chevrolet Tahoe stand at 1023 units through eleven months.

Canada november 2012 midsize suv sales chart
Midsize SUV Sales Chart
Of course, these big truck-based sport-utilities only account for 0.4% of the Canadian new vehicle market. For every Expedition Ford Canada sells, 24.5 Escapes find buyers.  

For all the Tahoes and Suburans and Yukons General Motors sells in Canada, the company sells 7.6 copies of the Equinox and Terrain. 

The Nissan Rogue is nearly 27 times more likely to be sold than the Nissan Armada. Toyota's RAV4 is 35 times more popular than the Sequoia. 


That should offer some perspective. Small SUVs and crossovers account for 19% of all new vehicle sales in Canada this year.

Canada November 2012 large suv sales chart
Large SUV Sales Chart
As always, you can click any model name in the tables visible after the jump to see historical monthly and yearly sales figures. Or you can select any make or model at GCBC's Sales Stats home. Any vehicle you can't find tabled here will be listed elsewhere - you can select from segments like small passenger cars and pickup trucks at GCBC's The Tally page.

Click any of the accompanying charts for a larger view. In those charts, SUVs are ranked by volume - they're listed alphabetically in the tables below.

Small SUV
November 2012
%
Change
Year To Date
YTD
% Change
1428
- 11.6%19,342- 7.3%
2091
+ 13.3%27,310+ 0.8%
3833
+ 46.7%41,318+ 0.2%
1057
+ 21.6%11,401+ 3.8%
2626
+ 7.5%31,380+ 35.2%
2394
+ 97.5%21,423- 7.5%
904
- 12.5%13,372- 1.3%
445
- 7.1%5702- 8.4%
443
- 35.2%6282- 20.7%
1140
+ 33.2%18,008+ 21.2%
924
- 25.5%13,009- 8.1%
607
- 2.6%7683+ 3.7%
991
-----10,515-----
10
- 98.9%3102- 48.8%
185
+ 27.6%1554+ 8.8%
532
- 8.4%4723- 6.8%
485
- 11.2%5936- 9.1%
256
- 52.3%3549- 14.5%
960
- 19.5%13,406+ 4.6%
507
- 39.0%6546- 19.1%
166
- 1.2%1677+ 1.3%
2017
+ 4.0%24,455+ 26.9%
476
+ 14.1%5381+ 9.2%

Midsize SUV
November 2012
%
Change
Year To Date
YTD
% Change
217
- 17.5%3074- 9.8%
217
- 26.9%3133- 35.0%
131
- 28.4%2261- 0.2%
1275
+ 21.3%17,826+ 22.9%
876
+ 19.8%9659+ 10.4%
214
+ 25.1%3061+ 15.3%
300
- 11.2%4554- 6.5%
496
+ 29.2%5409+ 34.2%
2394
+ 97.5%21,423- 7.5%
121
- 28.0%1880+ 33.9%
995
+ 2.3%9733+ 4.3%
10
- 87.5%874- 53.7%
924
- 25.5%13,009- 8.1%
98
+ 14.0%1230+ 6.7%
1
- 98.5%112- 71.4%
236
- 45.1%4062- 7.9%
678
+ 505%2136+ 22.8%
102
+ 15.9%855- 28.0%
31
- 24.4%350- 18.6%
237
+ 12.9%2628+ 12.4%
62
+ 19.2%626+ 8.7%
704
+ 4.8%6241+ 23.1%
200
+ 24.2%1826+ 21.1%