Showing posts with label US July 2012. Show all posts
Sunday, August 19, 2012

July 2012 Commercial Van Sales In America

While it may not seem important to casual auto industry observers who simply wish to find out which Japanese sedan was America's best-selling car in July 2012, commercial vans form a key part of an automaker's plans in the United States. Well, some automakers.
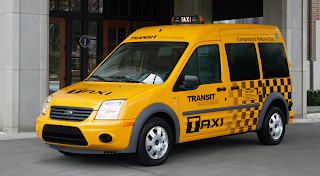
2011 Ford Transit Connect Taxi
Ford, for example, scored 6.7% of its total July volume with the E-Series and Transit Connect. With 11,201 sales between the two, these cargo (and sometimes personal use) vans were more important, on volume terms, than the Mustang, Taurus, Fiesta, Edge, Expedition, or Flex.

At General Motors, the Chevy Express and GMC Savana combined for 11,980 sales in July 2012. Combined, Chevrolet's Tahoe and Suburban didn't come up with that kind of volume.


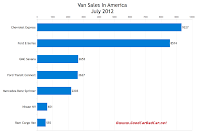
U.S. July 2012 cargo van sales chart
Commercial Van Sales Chart
Click For A Larger View
Over at Mercedes-Benz, the Sprinter was delivered to 473 more new owners than the CL, S, SL, SLK, SLS, G, and R-Classes put together. You can argue that the Sprinter doesn't make quite as much money for Mercedes-Benz as, perhaps, an S63 AMG, but with 2.6 times the volume and a simple chassis, Mercedes-Benz is probably quite thankful to have the Sprinter on its side.

Historical monthly and yearly sales figures for all these vans can be accessed through the first dropdown menu at GCBC's Sales Stats home or near the top right of this page. Below you'll find detailed July and year-to-date data.

Van
July 2012
%
Change
Year To Date
YTD
% Change
Chevrolet Express
9327
+ 74.6% 47,144 + 23.1%
Ford E-Series
8574
- 2.6% 75,839 + 6.3%
Ford Transit Connect
2627
+ 0.8% 19,581 + 10.2%
GMC Savana
2653
+ 118% 14,709 + 29.5%
Mercedes-Benz Sprinter
2203
+ 27.2% 11,479 + 30.0%
Nissan NV
651
- 4.1% 5536 + 212%
Ram Cargo Van
555
----- 3998 -----
Source: Manufacturers & ANDC

Related From GoodCarBadCar.net
Commercial Van Sales In America - August 2012
Commercial Van Sales In America - June 2012
Commercial Van Sales In America - May 2012
Minivan Sales In America - July 2012
U.S. Auto Sales By Brand - July 2012 Rankings
Saturday, August 18, 2012

July 2012 Truck Sales And Minivan Sales In America

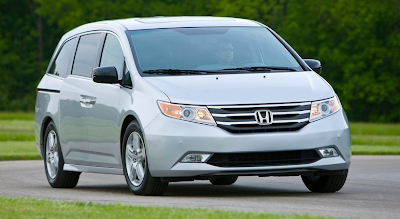
2012 Honda Odyssey silver
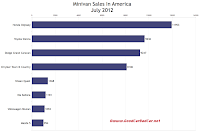
U.S. July 2012 minivan sales chart
Minivan Sales Chart
Click Either Chart For A Larger View
40% of the minivans sold in the United States in July 2012 were Chrysler-sold Town & Countrys and Grand Caravans. Neither the Chrysler T&C nor the Dodge Grand Caravan were America's best-selling minivan last month - the Honda Odyssey was. Odyssey sales jumped 89% in July; Honda owned 27% of America's minivan market. In all, Americans acquired 43,579 minivans in July, aside from the Ram Cargo Vans and Ford Transit Connects.

Chrysler's minivan dominance is clear. Pickup truck dominance is something that's routinely achieved by rival Ford with its F-Series, the best-selling vehicle in America. 33% of the trucks sold in the United States in July were full-size Fords. The disappearing Ranger has very nearly disappeared from new car showrooms: predictably, Ranger sales have fallen every month since October.
U.S. July 2012 Pickup truck sales chart
Truck Sales Chart

Historical monthly and yearly sales figures for every truck and minivan on sale in the United States can be found by accessing the first dropdown menu at GCBC's Sales Stats home or near the top right of this page. After the jump you'll find detailed July 2012 and year-to-date sales data for every minivan and truck which found buyers last month.

Minivan
July 2012
%
Change
Year To Date
YTD
% Change
Chrysler Town & Country
8106
+ 24.7%65,957+ 25.1%
Dodge Grand Caravan
9247
+ 42.6%78,211+ 23.3%
Honda Odyssey
11,953
+ 88.8%73,709+ 24.3%
Kia Sedona
1181
- 58.2%11,793- 14.7%
Mazda 5
994
- 16.2%7939- 38.8%
Nissan Quest
1368
- 4.1%12,111+ 83.0%
Toyota Sienna
9636
- 9.3%68,621+ 4.7%
Volkswagen Routan
1094
- 31.9%6116- 21.3%

Truck
July 2012
%
Change
Year To Date
YTD
% Change
Cadillac Escalade EXT
163
- 4.7%977- 8.4%
Chevrolet Avalanche
1823
+ 12.5%12,825+ 24.0%
Chevrolet Colorado
4096
+ 29.3%25,553+ 32.5%
Chevrolet Silverado
28,972
- 12.5%223,480+ 3.5%
Dodge Dakota
19
- 97.9%478- 94.8%
Dodge Ram
23,824
+ 17.3%162,405+ 22.8%
Ford F-Series
49,314
+ 0.4%350,455+ 11.9%
Ford Ranger
413
- 93.6%18,855- 48.3%
GMC Canyon
720
- 49.4%6361+ 14.2%
GMC Sierra
11,105
- 11.8%84,050+ 4.8%
Honda Ridgeline
981
+ 160%8250+ 48.3%
Nissan Frontier
5611
+ 16.1%34,996+ 23.8%
Nissan Titan
2028
+ 11.4%12,707+ 18.8%
Suzuki Equator
167
- 21.6%1115- 9.3%
Toyota Tacoma
11,350
+ 27.1%78,503+ 27.0%
Toyota Tundra
9176
+ 18.2%54,287+ 14.0%
Source: Manufacturers & ANDC

Related From GoodCarBadCar.net
Minivan & Truck Sales In America - August 2012
Truck & Minivan Sales In America - June 2012
Truck & Minivan Sales In America - July 2011
Top 30 Best-Selling Vehicles In America - July 2012
Top 5 Best-Selling Trucks In America - July 2012
U.S. Auto Sales By Brand - July 2012 Rankings
Wednesday, August 15, 2012

July 2012 Large Luxury Car Sales And Large Luxury SUV Sales In America

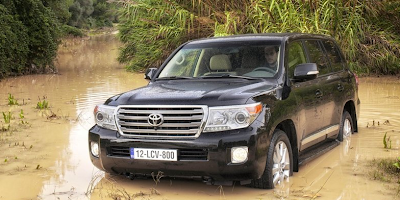
2013 Toyota Land Cruiser
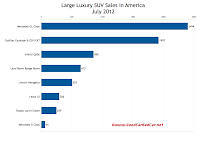
In a down year for the Cadillac Escalade, July 2012 was an up month in the United States. Sales of the regular wheelbase Escalade jumped 23% year-over-year, the Escalade ESV rose 18%, and the Escalade trio of jumbo utilities formed America's 22nd-best-selling premium vehicle. The Escalade was the 26th-best-selling premium vehicle in America a month earlier.
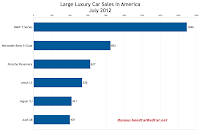
USA July 2012 large luxury car sales chart
Large Luxury Car Sales Chart
Click Either Chart For A Larger View

Of course, the Mercedes-Benz GL-Class, a true Escalade rival, was America's 15th-best-selling premium vehicle as GL jumped 32% from July 2011 levels. The GL-Class ranked 27th among premium nameplates in June.

Ah, but Cadillac has Mercedes-Benz beat with its top-end sedan, right? After all, Cadillac sold 1739 copies of their new XTS in July; Mercedes-Benz sold half that many S-Class sedans. Only thing is, the S-Class's price of entry is more than twice as lofty as the base price of an XTS. Yeah, not quite the same market. And the XTS better be selling twice as often if it's going to convey a premium image for half the price of an S-Class. It's also worth noting that the XTS tops out under $63,000. Cadillac's own CTS-V sedan starts at $64,515. That's not to say the V8-powered CTS is an S-Class competitor, but it does shine a light on the XTS's stature, or lack thereof.
USA July 2012 large luxury SUV sales chart
Large Luxury SUV Sales Chart

To go along with the jumbo-sized XTS, Hyundai sold another 362 Equus sedans in July, as well. As a result of price and perceived image, both cars are grouped with mostly smaller "midsize" luxury cars, sales figures for which were posted earlier.

The Mercedes-Benz S-Class was by no means the best-selling car in its class in July 2012. BMW sold nearly twice as many 7-Series sedans. The 7er was up 159% over July 2011. Historical monthly and yearly sales figures for all the vehicles displayed in the tables after the jump and in the accompanying charts can be accessed free of charge through the first dropdown menu at GCBC's Sales Stats home or near the top right of this page.

Large Luxury Car
July 2012
%
Change
Year To Date
YTD
% Change
Audi A8
401
- 10.9%2949- 10.6%
BMW 7-Series
1696
+ 159%7300+ 19.6%
Jaguar XJ
421
+ 8.8%3089- 10.0%
Lexus LS
536
- 14.4%3572- 26.0%
Mercedes-Benz S-Class
852
- 3.9%6362- 1.3%
Porsche Panamera
627
+ 1.3%4732+ 14.3%

Large Luxury SUV
July 2012
%
Change
Year To Date
YTD
% Change
Cadillac Escalade
& Escalade ESV/EXT
1997
+ 18.2%12,552- 5.8%
Infiniti QX56
890
- 12.4%7359+ 10.7%
Land Rover Range Rover
672
- 15.8%4832- 17.3%
Lexus LX570
306
+ 15.9%2874+ 65.5%
Lincoln Navigator
525
- 9.0%4381+ 0.3%
Mercedes-Benz G-Class
64
- 43.9%525- 29.7%
Mercedes-Benz GL-Class
2494
+ 32.0%14,076+ 8.9%
Toyota Land Cruiser
259
+ 162%1448+ 51.0%
Source: Manufacturers & ANDC

Related From GoodCarBadCar.net
Large Luxury Car & Large Luxury SUV Sales In America - August 2012
Large Luxury Car & SUV Sales In America - June 2012
Large Luxury Car & SUV Sales In America - July 2011
Top 30 Best-Selling Luxury Vehicles In America - July 2012
U.S. Auto Sales By Brand - July 2012 Rankings
Small/Entry & Midsize Luxury Car Sales In America - July 2012
Small & Midsize Luxury SUV Sales In America - July 2012
Monday, August 13, 2012

July 2012 Sporty Car Sales And Premium Sporty Car Sales In America

2012 Subaru Impreza WRX sedan
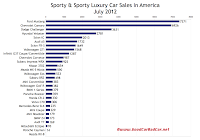
Ford only needs the Mustang to outsell the Chevrolet Camaro by 628 units in August in order for the company's pony car to take over the U.S. year-to-date lead through eight months. In July, Camaro sales slid 10%, Mustang sales jumped 8%, and the Ford outsold the Chevy by 445 units.


July 2012 U.S. sports car sales chart
Sporty Car Sales Chart
Click Either Chart For A Larger View
For coupe buyers who aren't so power-hungry, the Scion FR-S satisfied the requirements of 1649 U.S. buyers in July 2012. This means the FR-S outsold the Volkswagen GTI by 81 units. Throw the Golf R in with the GTI and the FR-S's lead disappears. Meanwhile, Subaru sold 925 Impreza WRXs and 498 BRZs, equaling 5.7% of the brand's total U.S. volume.

Among small German coupes and roadsters, the new Porsche Boxster cruised to victory over the Audi TT, BMW Z4, Mercedes-Benz SLK, and Porsche's own Cayman, all four of which recorded year-over-year declines. The Z4 and SLK both made it onto GoodCarBadCar's list of the 10 worst-selling cars in America in July.

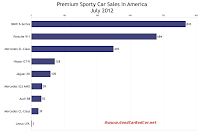
U.S. July 2012 premium sports car sales chart
Premium Sporty Car Sales Chart
At the high end, Porsche wasn't able to secure a victory over the BMW 6-Series, sales of which shot up 51% last month. The 6er ended July 31st 159 sales ahead of the Porsche 911, although the 911's lead through seven months remains more than 1000-units strong.

Historical monthly and yearly sales figures for all the vehicles you'll see after the jump (and in the two accompanying charts) can be accessed free of charge through the first dropdown menu at GCBC's Sales Stats home or near the top right of this page. Pertinent links to other editions of this story can be clicked at the bottom of this post.

Sporty Car
July 2012
%
Change
Year To Date
YTD
% Change
Audi A5
1732
+ 31.9%9734+ 6.6%
Audi TT
169
- 5.1%1311+ 7.4%
BMW 1-Series
379
- 42.9%4543- 13.6%
BMW Z4
173
- 61.9%1585- 36.3%
Chevrolet Camaro
6926
- 9.7%56,623+ 0.3%
Chevrolet Corvette
987
- 23.5%8009- 2.2%
Dodge Challenger
3631
+ 3.5%27,082+ 14.4%
Ford Mustang
7371
+ 8.3%55,995+ 22.1%
Honda CR-Z
330
- 62.4%2734- 69.2%
Hyundai Veloster
2781
-----21,610-----
Infiniti G37 Coupe/Convertible
1287
+ 1.3%8278- 10.6%
Mazda MX-5 Miata
590
+ 3.7%4016+ 9.9%
Mazda RX-8
-----
- 100%80- 85.3%
Mercedes-Benz SLK
235
- 78.9%2499+ 13.2%
Mini Convertible
383
- 23.2%3075- 1.3%
Mini Coupe
229
-----1794-----
Mini Roadster
179
-----1169-----
Mitsubishi Eclipse
93
- 88.1%977- 84.0%
Nissan 370Z
654
+ 18.9%5127+ 0.6%
Porche Boxster
359
+ 76.8%983- 25.2%
Porsche Cayman
14
- 88.7%415- 51.3%
Scion FR-S
1649
-----4419-----
Scion tC
2013
+ 26.6%13,572- 6.2%
Subaru BRZ
498
-----1587-----
Subaru Impreza WRX
925
- 15.8%7769+ 6.9%
Volkswagen Eos
533
- 53.8%4221- 13.3%
Volkswagen GTI
1568
+ 0.8%10,554+ 1.0%
Volkswagen Golf R
382
-----2339-----
Volvo C70
306
- 27.0%3170- 6.3%

Premium Sporty Car
July 2012
%
Change
Year To Date
YTD
% Change
Audi R8
55
- 32.9%558- 18.2%
BMW 6-Series
843
+ 50.5%4420+ 164%
Jaguar XK
105
- 16.7%970- 10.7%
Lexus LFA
3
- 57.1%27- 25.0%
Mercedes-Benz CL-Class
39
+ 62.5%426- 19.9%
Mercedes-Benz SL-Class
449
+ 383%2024+ 94.1%
Mercedes-Benz SLS AMG
59
+ 20.4%618+ 55.7%
Nissan GT-R
128
+ 129%711- 19.5%
Porsche 911
684
+ 42.5%5517+ 45.8%
Source: Manufacturers & ANDC
Clearly GoodCarBadCar is not suggesting that the cars in the two tables above are all direct competitors. Establishing categories among cars as unique as even the Audi TT and Porsche Boxster has never pleased a single reader, so cars have been lumped together so you can simply see how buyers looking for sports cars, roadsters, hot hatches, convertibles, GTs, and wanna-be sports cars spend their money. Greater categorization of cars would only lead to problems that automakers create by not isolating model-specific sales figures: we don't know how many M3s BMW has sold or how many Civics are Si models, for example. The numbers we do have are listed above.

Related From GoodCarBadCar.net
Sporty Car & Premium Sporty Car Sales In America - August 2012
Sporty & Premium Sporty Car Sales In America - June 2012
Sporty & Premium Sporty Car Sales In America - July 2011
Top 20 Best-Selling Cars In America - July 2012
Top 30 Best-Selling Luxury Vehicles In America - July 2012
Friday, August 10, 2012

July 2012 YTD - Top 261 Best-Selling Vehicles In America - Every Vehicle Ranked

2013 Chevrolet Spark White
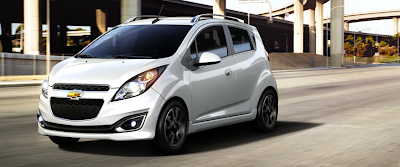
Information about the 8.4 million new vehicles Americans acquired in the first seven months of 2012 has been thoroughly manhandled by GoodCarBadCar and thrown into the table below. Every vehicle is ranked by total January-July U.S. volume, and in many cases, there are extra tidbits. For instance, how many BMW 335d sedans were sold in the first seven months of 2012. (Scroll down to the 48th spot to see.)
2012 Mercedes-Benz S350 BlueTec
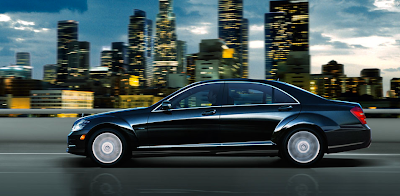
8.4% Of The 165th-Ranked M-B S-Class's Volume Comes From The Diesel-Powered S350
Much could be said about the Ford F-Series' dominance, the Toyota Camry's continued best-selling car status, the Audi A7's outselling of the Mercedes-Benz CLS, the surge of Honda's CR-V, the tie at 142nd between two fairly undesirable vehicles, the tie at 253rd between two wildly different and defunct Detroit vehicles, the fact that the Camry Hybrid is more popular than the majority of vehicle lines on this list, or the fact that the Mercedes-Benz S350 BlueTec is more popular than the Acura ZDX. But this isn't the only place where GoodCarBadCar covers U.S. July 2012 sales data. And some of these subjects have already been thoroughly covered, or will be in the coming days.
2009 BMW 335d
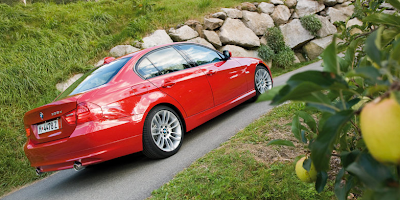
Still A Few Left: BMW USA Sold Hundreds Of 335d Sedans Between January And July
Don't forget to use your Command+F function (or Ctrl+F for non-Mac users) to search for a specific vehicle. The list is long, and it grows all the more intimidating when you skip past the top 30. There are pertinent links to other best sellers at the bottom of this post, and you can always find historical monthly and yearly sales figures for every vehicle currently on sale in North America by accessing the first dropdown menu at GCBC's Sales Stats home or near the top right of this page.
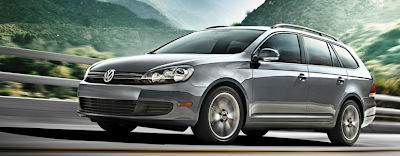
2013 Volkswagen Jetta Sportwagen Grey
Jetta SportWagen Sales Are Down 28% In 2012
Below you'll find 261 vehicle nameplates ranked by 2012 volume through the end of July. New to the group this month is the Chevrolet Spark, already ranked 223rd. And way down past all 261, past the commercial van totals and the totalled totals, some obvious pairings team up to show the strength of a variety of platforms. Italicized unranked lines are nothing more than available breakdowns, already included in the model's total, not in addition to the model's total.

Rank
Vehicle
July
2012 YTD
July
2011 YTD
% Change
#1
Ford F-Series
350,455 313,183 + 11.9%
#2
Toyota Camry
243,816 174,485 + 39.7%

* Camry Hybrid
26,747 5834 + 358%
#3
Chevrolet Silverado
223,480 215,906 + 3.5%

* Silverado Hybrid
297 627 - 52.6%
#4
Honda Civic
187,586 141,577 + 32.5%

Civic Hybrid
4589 2744 + 67.2%
#5
Honda Accord
183,817 143,936 + 27.7%
#6
Nissan Altima
183,703 153,182 + 19.9%

* Altima Hybrid
96 2563 - 96.3%
#7
Toyota Corolla/Matrix
175,366 154,324 + 13.6%
#8
Honda CR-V
167,236 124,859 + 33.9%
#9
Dodge Ram
162,405132,209+ 22.8%
#10
Ford Fusion
160,175 151,004 + 6.1%

* Fusion Hybrid
6097 7780 - 21.6%
#11
Chevrolet Malibu
153,782 142,312 + 8.1%

* Malibu Hybrid
8906 24 + 37,008%
#12
Ford Escape
148,739 147,018 + 1.2%

* Escape Hybrid
1214 6176 - 80.3%
#13
Ford Focus
147,877112,913+ 31.0%

* Focus Electric
135 ----- -----
#14
Toyota Prius
143,297 74,427 + 92.5%

Prius C
19,296 ----- -----

Prius Plug-In
5021 ----- -----
#15
Hyundai Sonata
138,390 135,898 + 1.8%

* Sonata Hybrid
12,455 7906 + 57.5%
#17
Chevrolet Equinox
130,796 112,932 + 15.8%
#17
Chevrolet Cruze
128,838 147,620 - 12.7%
#18
Hyundai Elantra
116,281 118,482 - 1.9%
#19
Chevrolet Impala
107,854 110,971 - 2.8%
#20
Toyota RAV4
104,686 81,969 + 27.7%
#21
Volkswagen Jetta
96,832 107,465 - 9.9%

Jetta SportWagen
12,647 17,584 - 28.1%

* Jetta TDI
28,225 32,125 - 12.1%
#22
Ford Explorer
89,891 75,720 + 18.7%

Explorer Police Interceptor
2857 ----- -----
#23
Jeep Grand Cherokee
86,688 63,869 + 35.7%
#24
Kia Optima
86,475 43,389 + 99.3%

* Optima Hybrid
6098 403 + 1413%
#25
Nissan Rogue
85,031 69,171 + 22.9%
#26
GMC Sierra
84,050 80,194 + 4.8%

* Sierra Hybrid
66 130 - 49.2%
#27
Jeep Wrangler
83,087 67,591 + 22.9%
#28
Toyota Tacoma
78,503 61,824 + 27.0%
#29
Chrysler 200
78,389 41,360 + 89.5%
#30
Dodge Grand Caravan
78,211 63,455 + 23.3%
Source: Manufacturers, ANDC & HybridCars.com
Red font indicates year-over-year declining sales
Check out the whole list!


Rank
Vehicle
July
2012 YTD
July
2011 YTD
% Change
#31
Ford Edge
74,613 69,685 + 7.1%
#32
Honda Odyssey
73,709 59,300 + 24.3%
#33
Kia Soul
73,698 65,118 + 13.2%
#34
Toyota Sienna
68,621 65,565 + 4.7%
#35
Mazda 3
68,554 60,832 + 12.7%
#36
Nissan Versa
68,370 51,245 + 33.4%
#37
Toyota Highlander
68,113 57,489 + 18.5%

* Highlander Hybrid
3520 2981 + 18.1%
#38
Kia Sorento
67,569 75,040 - 10.0%
#39
Chrysler Town & Country
65,957 52,711 + 25.1%
#40
Nissan Sentra
65,872 73,860 - 10.8%
#41
Honda Pilot
64,633 61,572 + 5.0%
#42
Volkswagen Passat
64,072 1403 + 4467%

* Passat TDI
13,538 589 + 2199%
#43
Subaru Outback
63,336 59,612 + 6.2%
#44
Dodge Avenger
58,050 34,099 + 70.2%
#45
Chevrolet Camaro
56,623 56,432 + 0.3%
#46
Ford Mustang
55,995 45,846 + 22.1%
#47
Chevrolet Traverse
54,612 64,310 - 15.1%
#48
BMW 3-Series
54,415 52,502 + 3.6%

* 335d
704 1866 - 62.3%
#49
Toyota Tundra
54,287 47,610 + 14.0%
#50
GMC Terrain
54,197 48,666 + 11.4%
#51
Dodge Charger
52,203 43,185 + 20.9%
#52
Subaru Impreza
52,180 24,370 + 114%

Impreza WRX
7769 7271 + 6.9%
#53
Lexus RX
51,374 45,309 + 13.4%

* RX450h
6747 6210 + 8.6%
#54
Jeep Liberty
50,142 37,109 + 35.1%
#55
GMC Acadia
49,550 50,235 - 1.4%
#56
Chevrolet Sonic/Aveo
48,576 24,615 + 97.3%
#57
Kia Forte
47,016 50,582 - 7.0%
#58
Ford Taurus
44,583 38,242 + 16.6%

Taurus Police Interceptor
3962 ----- -----
#59
Chrysler 300
44,200 16,096 + 175%
#60
Dodge Journey
43,802 31,285 + 40.0%
#61
Subaru Forester
43,549 43,360 + 0.4%
#62
Mercedes-Benz C-Class
43,349 34,535 + 25.5%
#63
Hyundai Accent
41,727 30,956 + 34.8%
#64
Chevrolet Tahoe
39,327 39,754 - 1.1%

* Tahoe Hybrid
310 397 - 21.9%
#65
Hyundai Santa Fe
39,059 42,940 - 9.0%
#66
Jeep Patriot
38,577 33,751 + 14.3%
#67
Infiniti G
36,114 32,806 + 10.1%

G37 Coupe/Convertible
8278 9262 - 10.6%
#68
Mercedes-Benz E-Class
35,455 37,074 - 4.4%

* E350 BlueTec
1811 1687 + 7.4%
#69
Ford Fiesta
35,385 47,425 - 25.4%
#70
Nissan Maxima
35,222 32,468 + 8.5%
#71
Nissan Frontier
35,996 28,271 + 23.8%
#72
Buick LaCrosse
34,893 35,298 - 1.1%

* LaCrosse eAssist
7625 ----- -----
#73
BMW 5-Series
33,451 29,605 + 13.0%

* ActiveHybrid 5
11 ----- -----
#74
Buick Enclave
32,226 34,149 - 5.6%
#75
Nissan Murano
31,542 29,076 + 8.5%
#76
Cadillac SRX
30,361 30,333 + 0.1%
#77
Cadillac CTS
30,226 31,454 - 3.9%
#78
Honda Fit
28,898 39,275 - 26.4%

Fit EV
7 ----- -----
#79
Acura MDX
28,405 25,633 + 10.8%
#80
Hyundai Tucson
27,895 27,016 + 3.3%
#81
Subaru Legacy
27,593 24,928 + 10.7%
#82
Chevrolet Suburban
27,513 22,871 + 20.3%
#83
Dodge Challenger
27,082 23,670 + 14.4%
#84
Toyota 4Runner
26,700 25,328 + 5.4%
#85
Mazda 6
26,658 18,115 + 47.2%
#86
Mini Cooper
26,621 25,098 + 6.1%

Hardtop
17,214 17,392 - 1.0%

Clubman
3369 4592 - 26.6%

Convertible
3075 3114 - 1.3%

Coupe
1794 ----- -----

Roadster
1169 ----- -----
#87
Kia Rio
26,042 12,944 + 101%
#88
Chevrolet Colorado
25,553 19,283 + 32.5%
#89
Volkswagen Golf
24,890 21,297 + 16.9%

GTI
10,554 10,449 + 1.0%

* TDI
5734 5968 - 3.9%

Golf R
2339 ----- -----
#90
Jeep Compass
24,612 25,191 - 2.3%
#91
Fiat 500
24,416 7982 + 206%
#92
Kia Sportage
24,188 29,302 - 17.5%
#93
Dodge Durango
24,182 28,935 - 16.4%
#94
Toyota Venza
23,498 22,661 + 3.7%
#95
Mercedes-Benz M-Class
22,416 16,967 + 32.1%

* ML350 BlueTec
3665 1877 + 95.3%

* ML450 Hybrid
18 1 + 1700%
#96
BMW X5
22,264 19,225 + 15.8%

* X5 xDrive35d
5829 3823 + 52.5%
#97
Hyundai Genesis
22,085 18,971 + 16.4%
#98
Lexus ES
22,024 19,446 + 13.3%
#99
Audi A4
22,008 21,085 + 4.4%
#100
Chevrolet Captiva Sport
21,835 ----- -----
#101
Nissan Juke
21,688 20,685 + 4.8%
#102
Hyundai Veloster
21,610 ----- -----
#103
Ford Expedition
21,313 22,001 - 3.1%
#104
Toyota Yaris
21,242 13,080 + 62.4%
#105
Acura TL
20,411 17,969 + 13.6%
#106
Mazda CX-5
20,239 ----- -----
#107
Buick Verano
19,904 ----- -----
#108
Acura TSX
19,594 16,346 + 19.9%

TSX SportWagon
2366 1906 + 24.1%
#109
Ford Ranger
18,555 36,442 - 48.3%
#110
Ford Flex
18,807 16,195 + 16.1%
#111
Toyota Avalon
18,341 16,139 + 13.6%
#112
Volkswagen Tiguan
17,906 16,382 + 9.3%
#113
Nissan Pathfinder
17,865 14,479 + 23.4%
#114
Lincoln MKZ
17,572 16,785 + 4.7%

* MKZ Hybrid
3220 3407 - 5.5%
#115
BMW X3
16,728 14,932 + 12.0%
#116
Buick Regal
16,612 25,512 - 34.9%

* Regal eAssist
1091 ----- -----
#117
Lexus IS
16,490 15,320 + 7.6%
#118
Audi Q5
15,634 13,035 + 19.9%
#119
Volkswagen Beetle
15,493 1042 + 1387%
#120
GMC Yukon
14,867 17,402 - 14.6%

* Yukon Hybrid
297 471 - 36.9%
#121
Volvo S60
14,382 12,632 + 13.9%
#122
Mercedes-Benz GLK
14,160 13,140 + 7.8%
#123
Lincoln MKX
14,152 12,728 + 11.2%
#124
Mercedes-Benz GL-Class
14,076 12,925 + 8.9%

* GL350 BlueTec
3601 2921 + 23.3%
#125
Acura RDX
13,937 8187 + 70.2%
#126
Scion tC
13,572 14,475 - 6.2%
#127
Mazda CX-9
13,087 18,179 - 28.0%
#128
Chevrolet Avalanche
12,825 10,339 + 24.0%
#129
Lexus GS
12,732 2406 + 429%

* GS450h
244 173 + 41.0%
#130
Nissan Titan
12,707 10,699 + 18.8%
#131
Cadillac Escalade
12,552 13,328 - 5.8%

Escalade
7117 7859 - 9.4%

Escalade ESV
4458 4402 + 1.3%

Escalade EXT
977 1067 - 8.4%

Escalade Hybrid
408626- 34.8%
#132
Nissan Quest
12,111 6618 + 83.0%
#133
Scion xB
11,914 9774 + 21.9%
#134
GMC Yukon XL
11,794 11,842 - 0.4%
#135
Kia Sedona
11,793 13,831 - 14.7%
#136
Mini Countryman
11,293 9429 + 19.8%
#137
Mitsubishi Galant
11,202 11,896 - 5.8%
#138
Mazda 2
11,056 8512 + 29.9%
#139
Mazda CX-7
10,983 18,738 - 41.4%
#140
Volkswagen CC
10,955 19,348 - 43.4%
#141
Lexus CT200h
10,945 5321 + 106%
T142
Honda Crosstour
10,837 11,518 - 5.9%
T142
Nissan Armada
10,837 10,208 + 6.2%
#144
Chevrolet Volt
10,666 2870 + 272%
#145
Nissan Xterra
10,542 9764 + 8.0%
#146
Volvo XC60
10,292 8503 + 21.0%
#147
Audi A6
10,275 4591 + 124%
#148
Mitsubishi Lancer
9859 12,379 - 20.4%
#149
Audi A5
9734 9133 + 6.6%
#150
Infiniti JX35
9724 ----- -----
#151
Mitsubishi Outlander Sport
9512 9414 + 1.0%
#152
Dodge Caliber
9502 24,810 - 61.7%
#153
Land Rover Range Rover Sport
8419 8129 + 3.6%
#154
Honda Ridgeline
8250 5562 + 48.3%
#155
Chevrolet Corvette
8009 8187 - 2.2%
#156
Mazda 5
7939 12,967 - 38.8%
#157
Lincoln MKS
7682 6272 + 22.5%
#158
Porsche Cayenne
7606 8219 - 7.5%

* Cayenne Hybrid
729 995 - 26.7%
#159
Suzuki SX4
7555 7237 + 4.4%
#160
Toyota FJ Cruiser
7415 8130 - 8.8%
#161
Infiniti QX56
7359 6649 + 10.7%
#162
BMW 7-Series
7300 6105 + 19.6%

* ActiveHybrid 7
219 222 - 1.4%
#163
Toyota Sequoia
7269 6931 + 4.9%
#164
Scion xD
6479 5871 + 10.4%
#165
Mercedes-Benz S-Class
6362 6449 - 1.3%

* S350 BlueTec
536 ----- -----

* S400 Hybrid
77 207 - 62.8%
#166
GMC Canyon
6361 5570 + 14.2%
#167
Volkswagen Routan
6116 7770 - 21.3%
#168
Lexus GX460
5701 6466 - 11.8%
#169
Scion iQ
5641 ----- -----
#170
Volvo XC90
5611 6059 - 7.4%
#171
Infiniti M
5593 6172 - 9.4%

* M Hybrid
373 146 + 156%
#172
smart fortwo
5528 2883 + 91.7%

* fortwo EV
135 88 + 53.4%
#173
Porsche 911
5517 3783 + 45.8%
#174
Audi Q7
5340 5504 - 3.0%

* Q7 TDI
1785 2314 - 22.9%
#175
Volkswagen Touareg
5254 3616 + 45.3%

* Touareg TDI
2612 1536 + 70.1%

* Touareg Hybrid
155 298 - 48.0%
#176
Infiniti FX
5195 5587 - 7.0%
#177
Hyundai Veracruz
5153 5162 - 0.2%
#178
Nissan 370Z
5127 5095 + 0.6%
#179
Land Rover Range Rover Evoque
4976 ----- -----
#180
Land Rover Range Rover
4832 5846 - 17.3%
#181
Audi A7
4827 2701 + 78.7%
#182
Porsche Panamera
4732 4141 + 14.3%

* Panamera Hybrid
275 ----- -----
#183
Mitsubishi Outlander
4699 5750 - 18.3%
#184
Nissan Cube
4663 12,614 - 63.0%
#185
Mercedes-Benz CLS-Class
4593 2032 + 126%
#186
BMW 1-Series
4543 5257 - 13.6%
#187
Honda Insight
4460 12,145 - 63.3%
#188
BMW 6-Series
4420 1672 + 164%
#189
Scion FR-S
4419 ----- -----
#190
Lincoln MKT
4386 2976 + 47.4%
#191
Lincoln Navigator
4381 4370 + 0.3%
#192
Land Rover LR4
4296 4710 - 8.8%
#193
Audi A3
4229 3803 + 11.2%

* A3 TDI
2318 2067 + 12.1%
#194
Volkswagen Eos
4221 4868 - 13.3%
#195
Hyundai Azera
4143 1239 + 234%
#196
Mazda MX-5 Miata
4016 3654 + 9.9%
#197
Lexus LS
3572 4827 - 26.0%

* LS600hL
40 45 - 11.1%
#198
Suzuki Kizashi
3544 4407 - 19.6%
#199
Nissan Leaf
3543 4806 - 26.3%
#200
Jaguar XF
3458 2877 + 20.2%
#201
Dodge Nitro
3182 13,984 - 77.2%
#202
Volvo C70
3170 3383 - 6.3%
#203
BMW X6
3095 3328 - 7.0%

* X6 ActiveHybrid
4 37 - 89.2%
#204
Jaguar XJ
3089 3431 - 10.0%
#205
Volvo XC70
3042 3156 - 3.6%
#206
Suzuki Grand Vitara
3035 2937 + 3.3%
#207
Audi A8
2949 3300 - 10.6%
#208
Lexus LX570
2874 1737 + 65.5%
#209
Ford Crown Victoria
2820 35,203 - 92.0%
#210
Honda CR-Z
2734 8890 - 69.2%
#211
Acura ILX
2659 ----- -----

ILX Hybrid
259 ----- -----
#212
Mercedes-Benz SLK
2499 2207 + 13.2%
#213
Cadillac XTS
2492 ----- -----
#214
Hyundai Equus
2347 1694 + 38.5%
#215
Volvo S80
2148 2996 - 28.3%
#216
Mercedes-Benz SL-Class
2024 1043 + 94.1%
#217
Infiniti EX
2011 3464 - 41.9%
#218
Land Rover LR2
1788 1418 + 26.1%
#219
Chevrolet Caprice PPV
1680 155 + 984%
#220
Volvo C30
1638 1946 - 15.8%
#221
Subaru BRZ
1587 ----- -----
#222
BMW Z4
1585 2488 - 36.3%
#223
Chevrolet Spark
1460 ----- -----
#224
Toyota Land Cruiser
1448 959 + 51.0%
#225
Mercedes-Benz R-Class
1402 1874 - 25.2%

* R-Class BlueTec
344 381 - 9.7%
#226
Audi TT
1311 1221 + 7.4%
#227
Subaru Tribeca
1242 1509 - 17.7%
#228
Suzuki Equator
1115 1230 - 9.3%
#229
Porsche Boxster
983 1315 - 25.2%
#230
Mitsubishi Eclipse
977 6102 - 84.0%

Eclipse Spyder
376 2788 - 86.5%
#231
Dodge Dart
974 ----- -----
#232
Jaguar XK
970 1086 - 10.7%
#233
Buick Lucerne
954 15,513 - 93.9%
#234
Lincoln Town Car
764 6686 - 88.6%
#235
Nissan GT-R
711 883 - 19.5%
#236
Lexus HS250h
626 1663 - 62.4%
#237
Mercedes-Benz SLS AMG
618 397 + 55.7%
#238
Audi R8
558 682 - 18.2%
#239
Mercedes-Benz G-Class
525 747 - 29.7%
#240
Mazda Tribute
503 1621 - 69.0%

* Tribute Hybrid
90 291 - 69.1%
#241
Acura ZDX
501 1052 - 52.4%
#242
Dodge Dakota
478 9106 - 94.8%
#243
Mitsubishi Endeavor
452 6546 - 93.1%
#244
Cadillac DTS
449 9453 - 95.3%
#245
Mercedes-Benz CL-Class
426 532 - 19.9%
#246
Porsche Cayman
415 852 - 51.3%
#247
Mitsubishi i MiEV
366 ----- -----
#248
Acura RL
254 895 - 71.6%
#249
Cadillac STS
149 2661 - 94.4%
#250
Mazda RX-8
80 544 - 85.3%
#251
Volvo S40
50 2668 - 98.1%
#252
Lexus LFA
27 36 - 25.0%
T253
Dodge Viper
20 128 - 84.4%
T253
Chevrolet HHR
20 35,819 - 99.9%
#255
Chevrolet Cobalt
11 835 - 98.7%
#256
Suzuki XL7
10 37 - 73.0%
#257
Mercedes-Benz B-Class
7 2 + 250%
#258
Honda Element
3 9225 - 100%
#259
Honda FCX
2 ----- -----
#260
Lexus SC430
2 18 - 88.9%
#261
Suzuki Forenza/Reno
1 1 0.0%
-----
Total
8,247,6637,243,504+ 13.9%
-----
---------------------------------
------- ----- -----
-----
Commercial Vans
178,286149,362+ 19.4%
-----
---------------------------------
------- ----- -----
-----
Overall Market
8,425,9497,392,866+ 14.0%
-----
-----
----- ----- -----

Chevrolet Silverado/GMC Sierra
307,530


Hyundai Sonata/Kia Optima
224,865


Honda Accord/Crosstour
194,654


Chevrolet Equinox/GMC Terrain
184,993


Dodge Grand Caravan /
Chrysler Town & Country
144,168


Chrysler 200/Dodge Avenger
136,439


Subaru Outback/Legacy
90,929


Hyundai Accent/Kia Rio
67,769


Chevrolet Tahoe/GMC Yukon
54,194


Hyundai Tucson/Kia Sportage
52,083


Chevrolet Suburban / 
GMC Yukon XL
39,307


Nissan Frontier/Suzuki Equator
36,111


Chevrolet Colorado/GMC Canyon
31,914


Audi A4/A5
31,742


Audi A6/A7
15,102


Mercedes-Benz S-Class/CL-Class
6788


Scion FR-S/Subaru BRZ
6006


Porsche Boxster/Cayman
1398

Source: Manufacturers, ANDC, & HybridCars.com
Red font indicates year-over-year declining sales
Italicized unranked lines are nothing more than available breakdowns, already included in the model's total, not in addition to the model's total. Sales data for brands such as Aston Martin, Ferrari, Lamborghini, Lotus, Maybach, Rolls-Royce etc. are unfortunately not broken down by model. ANDC estimates say sales for those brands through July were 476, 1050, 280, 140, 28, and 224, respectively. Total Maserati and Bentley volume is reported, but not by specific models. 
* unconfirmed by manufacturer's monthly report.

Related From GoodCarBadCar.net
Top 262 Best-Selling Vehicles In America - August 2012 YTD
Top 260 Best-Selling Vehicles In America - June 2012 YTD
U.S. Auto Sales By Brand - July 2012
Top 20 Best-Selling Cars In America - July 2012
Top 20 Best-Selling SUVs In America - July 2012
Top 5 Best-Selling Trucks In America - July 2012
Top 30 Best-Selling Luxury Vehicles In America - July 2012