 |
| Click Chart For Larger View |
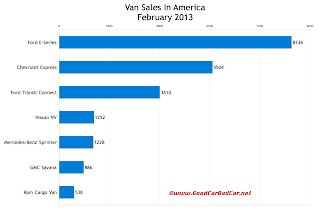
Overall, the segment was worth 1.8% of the new vehicle market's volume and through first two months of 2013, that figure stands at... 1.8%.
Fuly 58% of the commercial vans sold in the United States this year have been Fords. You can find historical monthly and yearly sales figures for any of the seven vans by clicking the model name below or by making a selection at GCBC's Sales Stats page.
Click Column Headers To Sort - January 2013 Edition
Van | February 2013 | % Change | Year To Date | YTD % Change |
|---|---|---|---|---|
5504 | + 4.7% | 9466 | - 3.3% | |
8336 | - 17.5% | 16,323 | - 3.3% | |
3610 | + 56.6% | 6771 | + 51.9% | |
886 | - 58.3% | 1930 | - 34.9% | |
1228 | + 48.0% | 2305 | + 31.4% | |
1252 | + 55.1% | 1995 | + 27.6% | |
538 | - 1.8% | 1051 | + 10.2% |
RECOMMENDED READING
Commercial Van Sales In America - January 2013
U.S. Auto Sales Brand Rankings - February 2013
Top 14 Best-Selling Pickup Trucks In America - February 2013
Minivan Sales In America - February 2013
No comments:
Post a Comment