Showing posts with label US August 2012. Show all posts
Tuesday, September 18, 2012

August 2012 Minivan Sales And Truck Sales In America

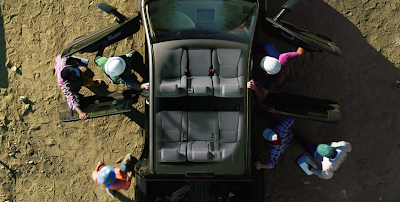
2012 Toyota Tundra Crewmax cabin
For the first time since December 2010, U.S. Toyota Tundra sales volume was measured with five digits. August 2012 Tundra sales rose 68% year-over-year, the best percentage increase of any pickup truck. Strictly measured by unit gains, the Toyota Tundra increased by 4595 sales. Ford F-Series sales jumped 19% in August 2012, a 9406-unit boost.
USA August 2012 truck sales chart
Pickup Truck Sales Chart
Click Either Chart For A Larger View

Of the 1,036,844 full-size pickup trucks sold under the Silverado, Ram, F-Series, Sierra, Titan, and Tundra nameplates in the first eight months of 2012, 6.3% were Tundras. Respectively, the F-Series, Silverado, Ram, Sierra, and Titan owned 39.4%, 25.2%, 18.1%, 9.5%, and 1.4% of America's full-size pickup truck market through the first eight months of 2012.

Tundra market share, though low, is up from 5.9% in the first eight months 0f 2011. The other five trucks, in the order already mentioned, held 39%, 27.2%, 16.5%, 10.1%, and 1.4% of America's pickup truck market between January and August of 2011.


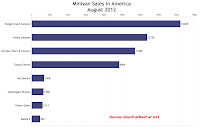
Ford, so dominant in the truck market, is absent in the minivan market. Chrysler, with the brand's Town & Country and Dodge's Grand Caravan, has seen tremendous growth from both vans in 2012. Compared with the first two-thirds of 2011, T&C sales have risen 26%; Grand Caravan sales are up 26%. 45% of all minivan sales in America this year have come from the Chrysler/Dodge duo. The Honda Odyssey ranks second with 86,459 sales, up 29% from last year. The Toyota Sienna is just 923 sales ahead of the Chrysler Town & Country in the bronze medal position.
USA minivan sales chart August 2012
Minivan Sales Chart

August marked just the seventh time in the last 32 months, but the second consecutive month, that Mazda 5 sales dipped below 1000 units. It's almost as though Mazda is trying to prove to every other automaker that quit the U.S. mini-minivan segment (or, more likely, never bothered to enter) by reporting lower and lower sales. Only 2.3% of the minivans sold in America this year have been Mazda 5s.

Want to go back in time? As always, historical monthly and yearly sales figures for any vehicle currently marketed in North America can be accessed through the first dropdown menu at GCBC's Sales Stats home or, for non-mobile users, near the top right of this page. But we've added links in the tables below which will take you directly to each vehicle's sales page. Just click the model name. That'll save you a couple steps.

After the jump you'll find detailed August and year-to-date U.S. sales figures for eight vans and 16 pickup trucks. Click either of the two accompanying charts for a larger view.

Minivan
August 2012
%
Change
Year To Date
YTD
% Change
11,405
+ 29.6%77,362+ 25.8%
16,428
+ 35.0%94,639+ 25.1%
12,750
+ 61.3%86,459+ 28.7%
1369
- 54.8%13,153- 21.9%
922
- 30.5%8861- 38.0%
1213
+ 2.6%13,324+ 70.8%
9664
+ 11.7%78,285+ 5.5%
1308
- 11.9%7424- 19.8%

Truck
August 2012
%
Change
Year To Date
YTD
% Change
183
+ 5.2%1160- 6.5%
2294
+ 28.2%15,119+ 24.7%
4222
+ 66.8%29,775+ 36.5%
38,295
+ 4.0%261,775+ 3.6%
Dodge Dakota
2
- 99.8%480- 95.2%
25,215
+ 18.7%187,620+ 22.3%
58,201
+ 19.3%408,656+ 12.9%
198
- 96.8%19,053- 55.3%
702
- 56.3%7063- 1.6%
14,495
+ 9.4%98,545+ 5.5%
919
+ 329%9169+ 58.7%
5464
+ 12.8%40,460+ 22.2%
1907
- 19.0%14,614+ 12.0%
154
- 15.4%1269- 10.1%
12,193
+ 41.0%90,696+ 28.7%
11,347
+ 68.1%65,634+ 20.7%
Source: Manufacturers & ANDC

Related From GoodCarBadCar.net
Minivan & Truck Sales In America - September 2012
U.S. Minivan & Truck Sales - July 2012
U.S. Minivan Sales - August 2011
U.S. Truck Sales - August 2011
Top 5 Best-Selling Trucks In America - August 2012
U.S. Auto Sales Brand Rankings - August 2012
Commercial Van Sales In America - August 2012

August 2012 Commercial Van Sales In America

2013 Ford Transit Custom Blue
Ford's Next Transit Is Perfect For Installing Solar
Panels On The Roof Of A Spectacular Chalet
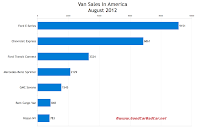
24,641 cargo vans - some of which were inevitably turned into RVs or airport hotel passenger transporters - were sold to American buyers in August 2012. 

Through eight months, sales of these seven vans have risen 19.1%. 

Together they've accounted for 2.1% of the America's overall new vehicle market in 2012, a market which has grown 14.7% year-over-year. In the first eight months of 2011 these vans were responsible for 2.0% of America's new vehicle market.

As the accompanying chart makes very clear, the Ford E-Series vans are America's favourites, although their share of the market is in decline. At this time last year, the Ford E-Series (not to be confused with the Mercedes-Benz E-Class) accounted for 47.2% of the commercial vans sold in the United States. That number has fallen to 41.9% in 2012. 

August 2012 U.S. cargo van sales chart
Commercial Van Sales Chart
Click Chart For Larger View
FoMoCo doesn't want this trend to continue, so the Blue Oval is about to start operating with Mercedes-Benz-like tendencies. Instead of offering a cargo van with an antiquated chassis to American customers, Ford will soon begin selling Europe's full-size Transit on this side of the Atlantic. The new version is pictured above. It's Sprinteresque.

As always, historical monthly and yearly sales figures for all these vans can be found by selecting a vehicle through the first dropdown menu at GCBC's Sales Stats home. There's way more data that can be accessed that way than you can possibly have interest in. You could also just click the model name below for monthly sales which go back as far as January 2010 and yearly sales which stretch back to 2002.

Van
August 2012
%
Change
Year To Date
YTD
% Change
6861
+ 17.9% 54,005 + 22.4%
9151
+ 0.1% 84,990 + 5.6%
3324
+ 21.6% 22,905 + 11.8%
1545
+ 72.6% 16,254 + 32.7%
2129
+ 15.3% 13,608 + 27.5%
783
+ 19.4% 6319 + 160%
848
+ 84,700% 4846 + 484,500%
Source: Manufacturers & ANDC

Related From GoodCarBadCar.net
Commercial Van Sales In America - September 2012
U.S. Commercial Van Sales - July 2012
All 262 Vehicles Ranked By August 2012 YTD Sales
U.S. Auto Sales By Brand - August 2012
Minivan & Truck Sales In America - August 2012
Monday, September 17, 2012

August 2012 Sporty Car Sales And Premium Sporty Car Sales In America

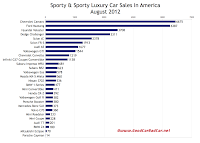
Total U.S. sales of the joint Toyota/Subaru sports car hit 2536 units in August 2012, harshly divided with 75% of buyers choosing in Scion's favour. For both Toyota's Scion division and Subaru (partly owned by ToMoCo, remember), August was the second-best month out of the four in which the BRZ and FR-S have been available.
August 2012 sports car sales chart U.S.
Sporty Car Sales Chart
Click Either Chart For A Larger View

1913 sales - the FR-S's total - sounds like a lot. And relatively speaking, it is. Nissan only sold 536 370Zs in August, and the Z is marketed with two different bodystyles. Volkswagen's Golf GTI and Golf R combined to outsell the Scion by just 13 units.

Yet, as always, true sports car volume is found in domestic showrooms where muscle cars like the Chevrolet Camaro and Ford Mustangs are sold. Okay, they're not really sports cars, not in the classic definition. But they do send lots of power to the rear wheels, they have two doors, and they place an emphasis on style over practicality. Chevrolet sold 3.5 Camaros for every one FR-S sold. And while Scion dealers won't be unhappy with their totals, you can see why industry observers consider the Camaro and Mustang to be current successes, not just historically important nameplates. The Camaro and Mustang are America's 47th and 48th-best-selling vehicles this year.


One other way to sell a lot of sporty coupes is to turn an inexpensive Korean hatchback into a two-door, then add a hidden third door, a weird name, and a turbocharged version. The Hyundai Veloster doesn't and shouldn't have the cachet of the Scion FR-S or Volkswagen GTI among auto enthusiasts. But it effectively sits on a fence between the Accent and Genesis Coupe (U.S. sales of which are frustratingly included in the Genesis' overall total) and since the FR-S's introduction has outsold the Scion 13,345 to 6332.
U.S. August 2012 premium sports car sales chart
Premium Sports Car Sales Chart

Easy math: Based purely on the MSRP of the basic FR-S we can say Scion sold $47.8 million worth of FR-S metal in August. Based purely on the MSRP of the basic 911, we'll say Porsche sold $51.6 million worth of 911s in August. See why the luxury car business is such a good business? Who needs volume when you can drain bank accounts?

Want to go back in time? As always, historical monthly and yearly sales figures for any vehicle currently marketed in North America can be accessed through the first dropdown menu at GCBC's Sales Stats home or, for non-mobile users, near the top right of this page. But we've added links in the tables below which will take you directly to each vehicle's sales page. Just click the model name. That'll save you a couple steps.

After the jump you'll find detailed August and year-to-date U.S. sales figures for more than three dozen coupes, convertibles, roadsters, grand tourers, and sporty derivatives of normal cars. Click either of the two accompanying charts for a larger view.

Sporty Car
August 2012
%
Change
Year To Date
YTD
% Change
1677
+ 26.9%11,411+ 9.1%
201
- 13.0%1512+ 4.1%
477
- 25.6%5020- 14.9%
180
- 40.8%1765- 36.8%
6675
- 2.2%63,298+ 0.1%
1219
+ 29.3%9219+ 1.1%
3311
+ 4.8%30,393+ 13.3%
6387
+ 11.7%62,382+ 21.0%
392
- 47.4%3126- 67.6%
3708
-----25,318-----
1138
- 11.2%9416- 10.7%
560
- 6.7%4576+ 7.6%
-----
- 100%80- 87.2%
373
+ 174%2872+ 22.6%
411
- 5.3%3486- 1.7%
228
-----2022-----
233
-----1402-----
70
- 88.7%1047- 84.4%
536
+ 3.7%5663+ 0.9%
380
+ 118%1363- 8.5%
14
- 89.1%429- 56.3%
1913
-----6332-----
2378
+ 113%15,950+ 2.3%
623
-----2210-----
681
- 15.0%8450+ 4.7%
578
- 21.9%4799- 14.4%
1544
+ 0.1%12,098+ 0.9%
382
-----2721-----
360
+ 8.4%3530- 5.0%

Premium Sporty Car
August
2012
%
Change
Year To Date
YTD
% Change
46
- 42.5%604- 20.7%
453
+ 119%4873+ 159%
110
+ 17.0%1080- 8.5%
2
- 50.0%29- 27.5%
64
- 41.8%490- 23.7%
604
+ 705%2628+ 135%
51
+ 59.4%669+ 55.9%
138
+ 23.2%849- 14.7%
628
+ 33.6%6145+ 44.5%
Source: Manufacturers & ANDC
Clearly GoodCarBadCar is not suggesting that the cars in the two tables above are all direct competitors. Establishing categories among cars as unique as even the Audi TT and Porsche Boxster has never pleased a single reader, so cars have been lumped together so you can simply see how buyers looking for sports cars, roadsters, hot hatches, convertibles, GTs, and wanna-be sports cars spend their money. Greater categorization of cars would only lead to problems that automakers create by not isolating model-specific sales figures: we don't know how many M3s BMW has sold or how many Civics are Si models, for example. The numbers we do have are listed above.

Related From GoodCarBadCar.net
Sporty Car & Premium Sporty Car Sales In America - September 2012
U.S. Sporty & Premium Sporty Car Sales - July 2012
U.S. Sporty & Premium Sporty Car Sales - August 2011
U.S. Auto Sales Brand Rankings - August 2012
Small/Entry Luxury & Midsize Luxury Car Sales In America - August 2012
Sunday, September 16, 2012

August 2012 Large Luxury Car Sales And Large Luxury SUV Sales In America

2012 Porsche Panamera Diesel badge

U.S. large luxury car sales chart August 2012
Large Luxury Car Sales Chart
Click Either Chart For A Larger View
Whatever the reason, in August 2012 BMW USA 7-Series sales hit the lowest level since GoodCarBadCar began tracking monthly volume. The 7-Series was outsold by all the cars it normally beats. Fortunately for BMW, this lapse hasn't taken away the 7er's year-to-date lead over the Mercedes-Benz S-Class and all its other large luxury limo rivals.

The S-Class, even with a 5.5% year-over-year decline of its own, did eat away at the 7-Series' lead. The gap now stands at 350 units through eight months. In second place in August was the Lexus LS. Soon to be replaced, the LS is down 23% this year. And in third place was the diesel-less Porsche Panamera. No, a large luxury car doesn't require a diesel to compete in the United States, although Mercedes-Benz's second-least-expensive S-Class is the S350 BlueTec diesel. (It costs $200 more than the Mercedes-Benz S400 Hybrid.)


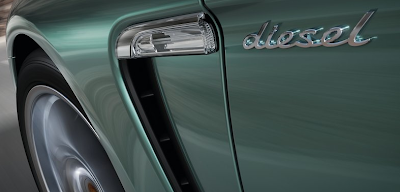
But Porsche does sell a Panamera diesel. And it's apparently very good. Still ugly, but very good, as Chris Harris makes clear in the Drive video embedded below. Porsche brought the Cayenne S Diesel to North America and they don't mask the fact that there's not a conventional gas-fired powerplant under the hood. It says diesel in large font on the side of the car. Just like the Panamera Diesel does, in countries where it's been made available.


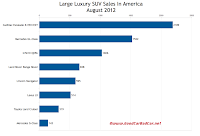
Among large luxury SUVs on sale in America, only the Mercedes-Benz GL-Class offers a diesel. Incidentally, the GL is the best-selling luxo jumbo sport-utility in the United States, although Cadillac took that crown in the month of August.

U.S. large luxury SUV sales chart August 2012
Large Luxury SUV Sales Chart
Want to go back in time? As always, historical monthly and yearly sales figures for any vehicle currently marketed in North America can be accessed through the first dropdown menu at GCBC's Sales Stats home or, for non-mobile users, near the top right of this page. But we've added links in the tables below which will take you directly to each vehicle's sales page. Just click the model name. That'll save you a couple steps.

After the jump you'll find detailed August and year-to-date sales info for six large luxury cars and eight large luxury SUVs. We don't include the Hyundai Equus and Cadillac XTS here because of their significantly lower price tags. For the record, you can find the 2158 XTS sales and 296 Equus sales in another post.

Large Luxury Car
August 2012
%
Change
Year To Date
YTD
% Change
470
+ 0.4%3419- 9.3%
339
- 56.3%7639+ 11.0%
426
+ 38.8%3515- 6.0%
786
- 3.7%4358- 22.8%
927
- 5.5%7289- 1.9%
646
+ 22.1%5378+ 15.2%