 |
| Skoda Roomster Scout |
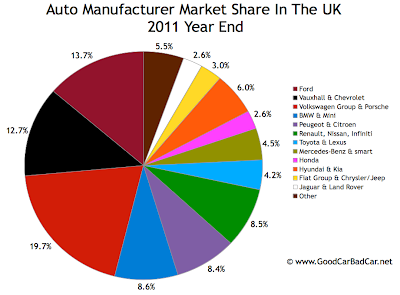
While Ford was the best-selling brand, a greater share of the market was owned by Volkswagen. By owning Audi, Skoda, and Seat, 19.7% of the UK market was Volkswagen's. General Motors, by the way, recorded a very similar 19.6% market share in America in 2011. Ford has no luxury division to boost its share in the United Kingdom as it does in the United States and Canada where its market share tallies are 16.8% and 17.4%, respectively.
BMW finished 2011 as the UK's top-selling premium car brand. Land Rover finished fourth. Compare that stat with Land Rover's finish in America. The Brits do like their homegrown brands, even if the revenue is now funnelled to overseas corporations like Tata, BMW, and Volkswagen. Mini very nearly out-sold Honda (and succeeded at doing so in December) while Jaguar's declining sales were still strong enough to see off Lexus.
As for non-Ford American brands, you'll have to scroll down a ways to find any. Chevrolet sold 12,524 cars in the United Kingdom in 2011, that's down 8.4% from 2010. Jeep's UK division sold 2146 vehicles in 2011 - Jeep sells that many Wranglers each week in the U.S. The Chrysler brand accounted for 1182 of Fiat's total sales in 2011. Infiniti is very much a Japanese brand but something of a U.S. creation. The brand has been very slow to take off on the other side of the Atlantic. Initially, Lexus was as well, and despite Toyota's troubles this year, Lexus improved its UK sales total by 33% in 2011. It takes time.
All the pertinent UK auto sales figures are below. Last year's version of this table can be viewed here.
Rank | Automaker | 2011 Year End | 2010 Year End | % Change |
#1 | Ford | 265,894 | 280,364 | - 5.2% |
#2 | Vauxhall | 234,710 | 247,265 | - 5.1% |
#3 | Volkswagen | 179,290 | 174,655 | + 2.7% |
#4 | BMW | 116,642 | 109,418 | + 6.6% |
#5 | Audi | 113,797 | 99,828 | + 14.0% |
#6 | Nissan | 96,269 | 89,681 | + 7.4% |
#7 | Peugeot | 94,989 | 109,324 | - 13.1% |
#8 | Mercedes-Benz | 81,873 | 74,977 | + 9.2% |
#9 | Toyota | 73,589 | 87,396 | - 15.8% |
#10 | Citroen | 68,464 | 73,317 | - 6.6% |
#11 | Renault | 68,449 | 95,608 | - 28.4% |
#12 | Hyundai | 62,900 | 61,752 | + 1.9% |
#13 | Kia | 53,615 | 56,114 | - 4.5% |
#14 | Honda | 50,577 | 63,652 | - 20.5% |
#15 | Mini | 50,138 | 43,894 | + 14.2% |
#16 | Skoda | 45,061 | 41,240 | + 9.3% |
#17 | Fiat | 41,612 | 53,092 | - 21.6% |
#18 | Land Rover | 37,637 | 37,272 | + 1.0% |
#19 | Seat | 36,089 | 32,935 | + 9.6% |
#20 | Volvo | 32,657 | 37,435 | - 12.8% |
#21 | Mazda | 31,219 | 45,449 | - 31.3% |
#22 | Suzuki | 20,295 | 21,484 | - 5.5% |
#23 | Jaguar | 13,787 | 16,417 | - 16.0% |
#24 | Chevrolet | 12,524 | 13,678 | - 8.4% |
#25 | Alfa Romeo | 11,563 | 8834 | + 30.9% |
#26 | Mitsubishi | 9843 | 12,209 | - 19.4% |
#27 | Lexus | 8269 | 6202 | + 33.3% |
#28 | Porsche | 6382 | 6784 | - 5.9% |
#29 | smart | 5044 | 7651 | - 34.1% |
#30 | Saab | 4138 | 5898 | - 29.8% |
#31 | Subaru | 2634 | 3897 | - 32.4% |
#32 | Jeep | 2146 | 2078 | + 3.3% |
#33 | Abarth | 1291 | 1425 | - 9.4% |
#34 | Chrysler | 1182 | 1392 | - 15.1% |
#35 | Bentley | 1037 | 993 | + 4.4% |
#36 | Aston Martin | 1024 | 1080 | - 5.2% |
#37 | Perodua | 543 | 761 | - 28.7% |
#38 | Proton | 446 | 767 | - 41.9% |
#39 | Maserati | 388 | 456 | - 14.9% |
#40 | Infiniti | 382 | 232 | + 64.7% |
#41 | MG | 360 | 282 | + 27.7% |
#42 | Lotus | 329 | 577 | - 43.0% |
#43 | Ssangyong | 194 | 242 | - 19.8% |
#44 | Daihatsu | 3 | 170 | - 98.2% |
Red font indicates declining year-over-year sales, bold indicates a so-called premium brand
 |
| CLICK CHART FOR LARGER VIEW |
UK Auto Sales Brand Rankings - 2012 Year End
UK Auto Sales By Brand - 2010 Year End
UK Auto Sales By Brand - December 2011
UK Auto Sales By Brand - January 2012
UK Auto Sales By Brand - January 2011
Top 10 Best-Selling Cars In The UK - 2011 Year End
No comments:
Post a Comment