Too little knowledge is a dangerous thing. Here's what you've heard: pickup truck sales are on the rise in America. You also remembering hearing that, in 2009, full-size pickup truck sales had steadily fallen year after year since 2004.
Clicking through truck sales figures by accessing the dropdown menu at the top right of this page is certainly informative, but it can be slightly misleading, as well. Yes, U.S. Ford F-Series sales fell each year from 2004 through 2009. Yes, Ford F-Series sales have increased both in 2010 and in 2011. Does this say something about the Ford F-Series or does it simply speak to the market as a whole?
America's six core full-size models, excluding the Chevrolet Avalanche and Cadillac Escalade EXT and any Lincoln entry, found 2,456,656 buyers in 2004 and just 1,117,706 buyers in 2009. It's hard to believe that pickup truck popularity died off that much relative to the popularity of passenger cars or SUVs or crossovers. In fact, during that period in which sales of those six trucks collectively dropped 54.5%, America's new vehicle market plunged 38.3%. Though the full-size truck market admittedly became less popular, sales weren't simply cut in half. America's new vehicle market was a much smaller playing field. Those six trucks were fighting for a slice of shrinking pie.
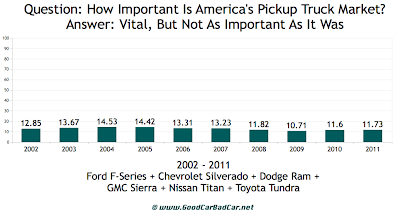
Nevertheless, the second chart in this post makes very clear that when the market shrunk, the market for America's six full-size offerings caved more precipitously. Those six trucks accounted for 14.5% of the overall new vehicle market in 2004 but just 10.7% in 2004. And now that the market has started to grow again - up to 11.6 million sales in 2010 and 12.8 million sales in 2011 - trucks are playing a larger role once again. The F-Series, Chevrolet Silverado, Dodge Ram, GMC Sierra, Nissan Titan, and Toyota Tundra accounted for 11.6% of the new vehicle market in 2010 and 11.7% in 2011.
All of this is explained by the two charts GoodCarBadCar compiled and inserted below. But it's not explained by simply scanning the sales figures for one vehicle and assuming the worst, or the best.
Related From GoodCarBadCar.net
Top 10 Best-Selling Trucks In America - 2011 Year End
Complete U.S. Truck Sales Chart - 2011 Year End
Top 30 Best-Selling Vehicles In America - 2011 Year End
Auto Brand Market Share In America - 2011 Year End
Clicking through truck sales figures by accessing the dropdown menu at the top right of this page is certainly informative, but it can be slightly misleading, as well. Yes, U.S. Ford F-Series sales fell each year from 2004 through 2009. Yes, Ford F-Series sales have increased both in 2010 and in 2011. Does this say something about the Ford F-Series or does it simply speak to the market as a whole?
America's six core full-size models, excluding the Chevrolet Avalanche and Cadillac Escalade EXT and any Lincoln entry, found 2,456,656 buyers in 2004 and just 1,117,706 buyers in 2009. It's hard to believe that pickup truck popularity died off that much relative to the popularity of passenger cars or SUVs or crossovers. In fact, during that period in which sales of those six trucks collectively dropped 54.5%, America's new vehicle market plunged 38.3%. Though the full-size truck market admittedly became less popular, sales weren't simply cut in half. America's new vehicle market was a much smaller playing field. Those six trucks were fighting for a slice of shrinking pie.
Nevertheless, the second chart in this post makes very clear that when the market shrunk, the market for America's six full-size offerings caved more precipitously. Those six trucks accounted for 14.5% of the overall new vehicle market in 2004 but just 10.7% in 2004. And now that the market has started to grow again - up to 11.6 million sales in 2010 and 12.8 million sales in 2011 - trucks are playing a larger role once again. The F-Series, Chevrolet Silverado, Dodge Ram, GMC Sierra, Nissan Titan, and Toyota Tundra accounted for 11.6% of the new vehicle market in 2010 and 11.7% in 2011.
All of this is explained by the two charts GoodCarBadCar compiled and inserted below. But it's not explained by simply scanning the sales figures for one vehicle and assuming the worst, or the best.
 |
| Click Either Chart For A Larger View |
Top 10 Best-Selling Trucks In America - 2011 Year End
Complete U.S. Truck Sales Chart - 2011 Year End
Top 30 Best-Selling Vehicles In America - 2011 Year End
Auto Brand Market Share In America - 2011 Year End


No comments:
Post a Comment