 |
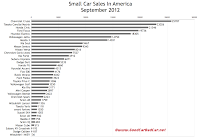
| Small Car Sales Chart Click Any Chart For A Larger View |
Elsewhere, Ford Fiesta sales fell slightly, the Mazda 2 plunged 21%, and Toyota Yaris sales plummeted 30%. The Versa, Fit, and Accent were down 32%, 2%, and 5%, respectively. Not including cars like the Scion iQ, Fiat 500, Chevrolet Spark, or Mini Cooper, the segment - as defined by the Versa, Sonic, Fit, Accent, Fiesta, Prius C, Rio, Yaris, and 2 - accounted for 3.1% of the overall market in September 2012.
 |
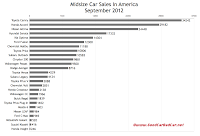
| Midsize Car Sales Chart |
So growth in the subcompact sector is slightly slower than that which is clearly visible in the rest of the industry? Be careful before you draw such conclusions. For one thing, we're just talking about one month, albeit a month with very high fuel prices. Through the first three quarters of 2012, the Sonic, Accent, Rio, 2, Versa, and Yaris have all posted notable gains. Second, a new crop of smaller-than-thou alternatives add to the small car sector's total volume. Fiat 500 sales rose by 1403 units, year-over-year, to make September the Cinquecento's best month yet. Chevrolet threw down another 2223 Sparks. Scion sold 683 iQ four-seaters. And smart fortwo sales jumped 120%, making September the fortwo's second month this year with 1000+ units.
 |
| Large Car Sales Chart |
Historical monthly and yearly sales results for 282 different vehicles can be accessed through the first dropdown menu at GCBC's Sales Stats home or, for non-mobile users, near the top right of this page. Click any model in the tables below to go directly to its specific sales results page.
After the jump you'll find detailed September and year-to-date sales info on a bunch of tiny, small, midsize, and large cars. The three accompanying charts rank cars by volume rather than listing alphabetically; click any of them for a larger view.
Small Car | September 2012 | % Change | Year To Date | YTD % Change |
4042 | ----- | 29,146 | ----- | |
25,787 | + 42.5% | 180,600 | - 3.7% | |
1 | - 99.4% | 21 | - 99.9% | |
7527 | + 179% | 64,807 | + 115% | |
2223 | ----- | 6313 | ----- | |
187 | - 92.7% | 10,021 | - 67.2% | |
5235 | ----- | 9254 | ----- | |
4176 | + 50.6% | 32,742 | + 136% | |
3923 | - 1.1% | 43,484 | - 24.0% | |
19,736 | + 91.4% | 186,686 | + 36.0% | |
21,546 | + 57.0% | 234,029 | + 39.8% | |
4660 | - 1.6% | 38,578 | - 19.6% | |
4313 | - 4.7% | 51,438 | + 26.2% | |
18,305 | + 27.2% | 152,575 | + 3.1% | |
6912 | + 26.6% | 61,228 | - 2.4% | |
3171 | + 1569% | 32,815 | + 138% | |
9467 | + 42.0% | 93,356 | + 18.7% | |
756 | - 20.9% | 12,729 | + 17.3% | |
14,031 | + 57.1% | 93,705 | + 18.3% | |
2897 | + 3.8% | 33,186 | + 9.3% | |
36 | ----- | 439 | ----- | |
1326 | - 14.6% | 12,768 | - 20.5% | |
515 | + 17.0% | 5812 | - 57.4% | |
9345 | + 15.3% | 85,840 | - 4.6% | |
8016 | - 32.1% | 85,572 | + 19.5% | |
683 | ----- | 6872 | ----- | |
1799 | + 27.1% | 15,592 | + 20.2% | |
942 | + 40.4% | 8425 | + 15.5% | |
1030 | + 120% | 7311 | + 94.6% | |
6071 | + 81.8% | 63,651 | + 105% | |
192 | ----- | 192 | ----- | |
1003 | + 0.6% | 9561 | + 1.6% | |
23,026 | + 42.6% | 222,703 | + 19.2% | |
3386 | ----- | 26,110 | ----- | |
1118 | - 30.2% | 23,818 | + 50.8% | |
2622 | + 263% | 21,566 | + 1122% | |
3250 | + 29.5% | 32,408 | + 19.8% | |
14,750 | - 1.8% | 127,028 | - 7.3% |
Midsize Car | September 2012 | % Change | Year To Date | YTD % Change |
1839 | - 44.7% | 20,523 | - 37.2% | |
11,188 | + 0.7% | 179,465 | + 4.8% | |
2851 | + 294% | 16,348 | + 320% | |
9881 | + 13.5% | 100,267 | + 71.3% | |
8716 | + 89.1% | 74,739 | + 66.0% | |
969 | ----- | 969 | ----- | |
12,300 | - 37.0% | 194,165 | + 3.0% | |
29,182 | + 56.6% | 247,847 | + 36.9% | |
2138 | + 86.2% | 14,995 | + 6.4% | |
246 | - 52.0% | 5047 | - 62.9% | |
17,332 | - 4.7% | 175,346 | + 0.3% | |
14,304 | + 131% | 114,728 | + 106% | |
1403 | - 66.3% | 29,653 | + 19.0% | |
520 | - 38.2% | 12,298 | - 11.0% | |
24,448 | + 0.4% | 234,040 | + 16.7% | |
984 | - 4.6% | 5212 | - 27.6% | |
4124 | + 31.4% | 35,589 | + 13.6% | |
10,583 | + 39.1% | 85,204 | + 13.9% | |
416 | - 11.1% | 4390 | - 19.4% | |
34,242 | + 37.8% | 314,788 | + 37.1% | |
18,932 | + 103% | 183,340 | + 96.6% | |
* Prius | 10,806 | + 15.9% | n/a | n/a |
* Prius C | 3386 | ----- | 26,110 | ----- |
* Prius V | 3088 | ----- | n/a | ----- |
1652 | ----- | 7720 | ----- | |
4229 | + 22.8% | 31,414 | + 5.3% | |
9500 | + 199% | 83,662 | + 1610% | |
1966 | + 22.1% | 15,015 | - 35.6% |
Large Car | September 2012 | % Change | Year To Date | YTD % Change |
4580 | + 5.6% | 45,066 | + 0.02% | |
2 | - 99.8% | 966 | - 94.6% | |
15,259 | + 10.4% | 140,179 | + 1.5% | |
4762 | + 7.1% | 53,630 | + 129% | |
5863 | - 13.7% | 63,485 | + 17.2% | |
5555 | + 29.0% | 56,848 | + 19.6% | |
891 | + 1028% | 5993 | + 326% | |
5718 | - 6.8% | 46,121 | + 3.4% | |
1571 | - 36.5% | 21,673 | + 3.2% |
Related From GoodCarBadCar.net
Small, Midsize & Large Car Sales in America - October 2012
Small, Midsize & Large Car Sales In America - August 2012
Small, Midsize & Large Car Sales In America - September 2011
Top 20 Best-Selling Cars In America - September 2012
U.S. Auto Sales Brand Rankings - September 2012

No comments:
Post a Comment