Auto sales fluctuate like Bay of Fundy tides. While you're going to buy groceries no matter what, and while you'll forever remain keen on replacing your shoes when the sole is worn through, delaying the acquisition of a new car as a result of prevailing economic conditions is downright normal behaviour.
The reverse is true, as well. A sudden decline in interest rates may speed up your trade-in. Drastic incentives on high-priced vehicles may propel you toward premium showrooms you hadn't previously entered. As quickly as your mind can change, so can the minds of millions of other car buyers. Thus, when you're not buying a new car for specific reasons, it's quite likely that hundreds of thousands of others aren't buying new cars for the exact same reasons.
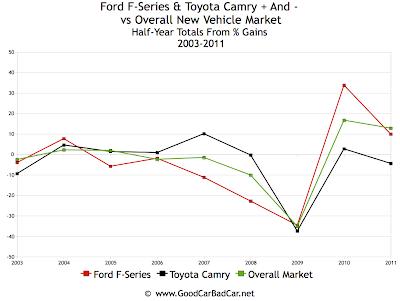
Starting in 2003, the overall new vehicle market in the United States declined slightly, then rose slightly in 2004, improved again in 2005, slid a bit in 2006, slid a bit more in 2007, fell way back in 2008 and 2009, then improved markedly in 2010 and again in 2011. This is based on half-year numbers from the last nine years, the last ten if you consider the fact that 2003's numbers are based on year-over-year declines compared with 2002.
America's best-selling vehicle is - and has been for quite some time - the Ford F-Series. Naturally, the F-Series rises and falls with the overall market, but it often takes the trend to the extreme. Its fall in 2003 was worse; its gains in 2004 were greater. In the first half of 2005, when the new car market was growing slightly, F-Series sales were falling, but not dreadfully so. But in 2007 and 2008 Ford's full-size pickup line felt the brunt of buyer rejection far more than the overall market. And while the first six months of 2010 manifested tremendous gains for the F-Series, particularly when compared with the overall new vehicle market, still-rising 2011 totals are 39% down from 2004 half-year levels. That's in a market which has fallen 24.7%.
There are numerous factors at play here, most notably an amazingly repercussive recession and rising fuel prices. This also holds true for America's best-selling car, the Toyota Camry. Added to ever-changing market conditions were recalls which severely impacted the Camry's reputation in 2009 and 2010 as well as inventory issues in 2011. Nevertheless, the Camry has remained popular, never completely following the U.S. automotive market's trend.
In 2003, the Camry was hit harder than the overall market, but its bounce back in 2004 was more substantial. The same could not be said of its growth in 2005, although the gap was close. And then during times of declining sales in 2006, 2007, and 2008 the Camry held firm or improved. The first half of 2009 was bad for everybody; only a little worse for the Camry. 2010 auto sales figures were full of year-over-year growth statistics, but the Camry's volume gain was insubstantial. Finally, in the first six months of 2011, the Camry hasn't been able to maintain last year's volume while the market is up 12.8%.
All of these figures are displayed simply in the chart above. Just click it to see a larger view.
The reverse is true, as well. A sudden decline in interest rates may speed up your trade-in. Drastic incentives on high-priced vehicles may propel you toward premium showrooms you hadn't previously entered. As quickly as your mind can change, so can the minds of millions of other car buyers. Thus, when you're not buying a new car for specific reasons, it's quite likely that hundreds of thousands of others aren't buying new cars for the exact same reasons.
Starting in 2003, the overall new vehicle market in the United States declined slightly, then rose slightly in 2004, improved again in 2005, slid a bit in 2006, slid a bit more in 2007, fell way back in 2008 and 2009, then improved markedly in 2010 and again in 2011. This is based on half-year numbers from the last nine years, the last ten if you consider the fact that 2003's numbers are based on year-over-year declines compared with 2002.
America's best-selling vehicle is - and has been for quite some time - the Ford F-Series. Naturally, the F-Series rises and falls with the overall market, but it often takes the trend to the extreme. Its fall in 2003 was worse; its gains in 2004 were greater. In the first half of 2005, when the new car market was growing slightly, F-Series sales were falling, but not dreadfully so. But in 2007 and 2008 Ford's full-size pickup line felt the brunt of buyer rejection far more than the overall market. And while the first six months of 2010 manifested tremendous gains for the F-Series, particularly when compared with the overall new vehicle market, still-rising 2011 totals are 39% down from 2004 half-year levels. That's in a market which has fallen 24.7%.
 |
| CLICK GRAPH FOR LARGER VIEW |
In 2003, the Camry was hit harder than the overall market, but its bounce back in 2004 was more substantial. The same could not be said of its growth in 2005, although the gap was close. And then during times of declining sales in 2006, 2007, and 2008 the Camry held firm or improved. The first half of 2009 was bad for everybody; only a little worse for the Camry. 2010 auto sales figures were full of year-over-year growth statistics, but the Camry's volume gain was insubstantial. Finally, in the first six months of 2011, the Camry hasn't been able to maintain last year's volume while the market is up 12.8%.
All of these figures are displayed simply in the chart above. Just click it to see a larger view.


supreme
ReplyDeleteyeezy 500
curry 6 shoes
yeezy boost 350
off white jordan 1
jordan shoes
kd13
yeezy boost 350
yeezy shoes
moncler outlet