Wednesday, November 21, 2012

October 2012 Canada Truck Sales And Minivan Sales

2013 Chevrolet Orlando interior cutaway
Model by model, the October 2012 and year-to-date Canadian sales results for 15 different pickup trucks are listed in the table after the jump. Trucks are ranked by October volume in the accompanying chart, which you can click for a larger view.

But these are the numbers you won't see without doing the math: 22,667 pickup trucks were sold in Canada in October 2012. That's 16.7% of the overall new vehicle market. 35% of those trucks sold were Ford F-Series pickups. 11% of the trucks were sold by Japanese automakers, although they account for more than one-third of the pickup nameplates.

Canada October 2012 pickup truck sales chart
Pickup Truck Sales Chart
Click either chart For A Larger View
7744 minivans and mini-minivans were sold in Canada in October 2012, equal to 5.7% of Canada's overall new vehicle market. Think the F-Series was dominant in the truck category? Dodge's Grand Caravan represented 43% of the minivan segment. That's down from 49% in September when the Chevrolet Orlando and Kia Rondo weren't so strongly challenging the Grand Caravan at the less costly end of the minivan market.

The Orlando and Rondo combined to own 26% of Canada's October minivan market, up from 16.1% in September. Although Toyota and Honda have sold more Siennas and Odysseys in the first ten months of 2012, the Orlando/Rondo superiority in October will come as a shock to American observers who have never been able to buy an Orlando and haven't registered a Rondo since last December.

Canada minivan sales chart October 2012
Minivan Sales Chart
As will always be the case in the future, historic brand and corporate totals (monthly and yearly going back to 2004) are now available through the dropdown menu at GCBC's Sales Stats page, along with results for more than 260 currently sold vehicles. That's where you'll find out that Kia Rondo sales are up 253% compared with October 2010.

Detailed October 2012 and year-to-date U.S. sales figures for 15 trucks and ten minivans are visible below. If the vehicle you're looking for isn't grouped together with these vehicles, perhaps you'll find it in one of the many segments you can access through the eighth dropdown menu on GCBC's Tally page.

Truck
October 2012
%
Change
Year To Date
YTD
% Change
13
- 35.0%135- 21.1%
352
+ 0.6%3105+ 0.6%
43
- 76.8%1396- 37.2%
2880
- 24.3%31,027- 6.7%
Dodge Dakota
-----
- 100%45- 96.6%
5602
+ 4.0%58,839+ 9.3%
8020
+ 15.4%92,094+ 12.9%
23
- 98.0%3628- 74.3%
31
- 79.5%1244- 34.9%
3154
- 32.0%36,566- 5.5%
269
+ 24.5%1829+ 39.2%
270
+ 61.7%2560+ 16.9%
356
+ 2.0%3033+ 23.7%
1074
+ 27.7%8179+ 29.2%
580
- 4.1%6159+ 9.1%

Minivan
October 2012
%
Change
Year To Date
YTD
% Change
1044
+ 157%5631+ 1049%
159
- 69.6%3592- 10.9%
3351
+ 12.9%45,687- 2.7%
784
+ 10.3%8014+ 9.6%
1005
+ 157%5116- 9.2%
153
+ 107%810- 31.5%
299
- 16.7%4615- 14.7%
59
- 41.0%605- 22.5%
842
- 15.1%10,124+ 8.6%
48
+ 41.2%545- 25.4%
Source: Manufacturers & ANDC

Related From GoodCarBadCar.net
Minivan Sales In Canada - November 2012
Pickup Truck Sales In Canada - November 2012
Truck Sales & Minivan Sales In Canada - September 2012
Truck Sales & Minivan Sales In Canada - October 2011
Canada Auto Sales Brand Rankings - October 2012
Top 5 Best-Selling Trucks In Canada - October 2012
Top 30 Best-Selling Vehicles In Canada - October 2012
Canada Commercial Van Sales - October 2012

October 2012 Canada Commercial Van Sales

Commercial van sales chart Canada October 2012
Click Chart For Larger View
As a group, commercial vans were responsible for just 1.3% of Canada's overall new vehicle market in October 2012. Year-to-date, the same seven vans account for 1.8% of the 1.44 million new vehicles sold in Canada. 

The rough October had plenty to do with the segment's two most popular models, both of which are Fords. E-Series sales slid 5.5%, or 26 units. The Transit Connect was down 23%, equal to 92 units. 

Here's hoping that Ford begins listing the it's-not-a-minivan-but-well-it-is-kind-of-a-minivan 2014 Ford Transit Connect Wagon separately from the Transit Connect when it goes on sale later next year. For now, a Transit Connect Wagon is a rare item indeed, and sales of any passenger version of any of these vans is included in these totals. The interior of the 2014 passenger van is pictured above.


Click any model name in the table below for a look at historic totals. The accompanying chart ranks these commercial vans by October 2012 volume.

Van
October 2012
%
Change
Year To Date
YTD
% Change
301
+ 16.7% 4138 - 0.6%
445
- 5.5% 8406 + 12.1%
308
- 23.0% 4230 + 3.1%
216
- 39.3% 3431 - 15.0%
277
+ 81.0% 2313 + 20.8%
100
+ 75.4% 914 + 150%
149
+ 79.5% 2028 + 617%
Source: Manufacturers & ANDC

Related From GoodCarBadCar.net
Commercial Van Sales In Canada - November 2012
Commercial Van Sales In Canada - September 2012
Canada Auto Sales Brand Rankings - October 2012
Truck Sales And Minivan Sales In Canada - October 2012
Tuesday, November 20, 2012

October 2012 Canada Small, Midsize, And Large SUV Sales

2013 Honda Pilot dark cherry pearl
Earlier this morning we explored the subject of Canada's non-car-oriented vehicle market. Canada's best-selling cars are easily more popular than Canada's top-selling crossovers and SUVs, but the growth many small crossovers enjoyed in October 2012 was something to behold. As the overall vehicle market recorded a 7.8% year-over-year improvement last month, some two dozen mainstream brand SUVs and crossovers exceeded that figure.

Canada october 2012 small suv sales chart
Small SUV Sales Chart
Click Any Chart For A Larger View
From the Ford Escape's 1040-unit increase, a 31% jump, to the Toyota Sequoia's 15-unit increase, which translated to a 26% improvement, a wide variety of utility vehicles posted meaningful advancements. Toyota sold 576 more RAV4s this October than a year ago. GMC sold 242 more Terrains. Jeep sold 205 more Wranglers; Hyundai an extra 240 Santa Fes; Honda 353 more Pilots; Toyota another 379 Highlanders.

Year-to-date, SUVs of one kind or another are the sixth, 11th, 13th, 16th, 18th, 19th, 20th, and 21st-best-selling vehicles in Canada when compared with all other vehicle types. 2011 ended with SUVs as the seventh, 12th, 15th, 16th, 17th, 19th, 23rd, and 24th-best-selling vehicles in Canada. Too many numbers? Put simply, Canada's eight leading utility vehicles rank higher this year than they did last year.

Canada october 2012 midsize suv sales chart
Midsize SUV Sales Chart
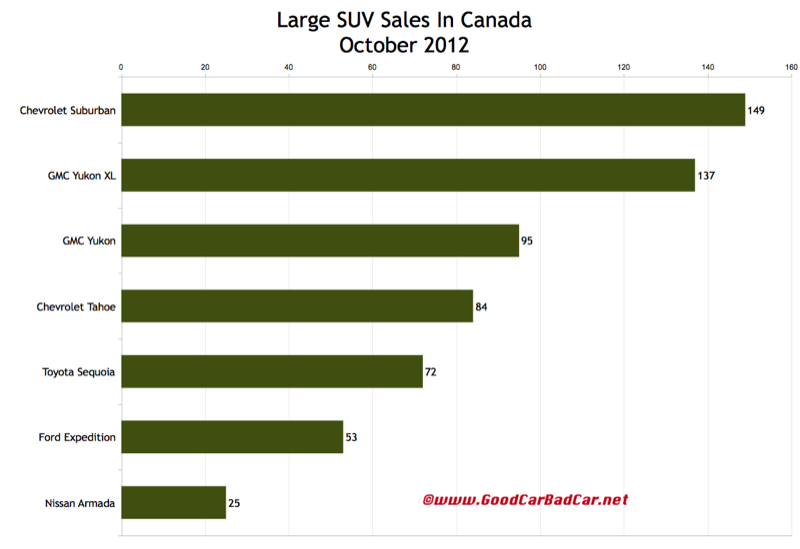
Not all SUV types are vital to the health of Canada's auto industry. The seven full-size SUVs in the table at the bottom of this post and in the accompanying chart accounted for less than one half of one percent of the overall new vehicle market in October.

However, Canada's seven most popular utility vehicles in October - the Ford Escape, Honda CR-V, Toyota RAV4, Dodge Journey, Hyundai Santa Fe, Chevrolet Equinox, and Ford Edge - accounted for 12.4% of the market. (For some perspective, consider that Canada's seven most popular cars accounted for 17.4% of the market.)

The tables visible after the jump break down Canada's October 2012 SUV/CUV situation with detailed year-over-year and year-to-date sales figures. The Volkswagen Touareg has been added to the midsize SUV table but we'll also be showing it with the more similarly-priced midsize luxury SUVs.


Canada october 2012 large suv sales chart
Large SUV Sales Chart
This is where we tirelessly point out that historic brand and corporate totals (monthly and yearly going back to 2004) are now available through the dropdown menu at GCBC's Sales Stats page, along with results for more than 260 currently sold vehicles. That's where you'll find out that 

If the vehicle you're looking for isn't grouped together with these SUVs, it may be listed with cars, with luxury SUVs, or in one of the other segments you can access through the eighth dropdown menu on GCBC's Tally page.

Small SUV
October 2012
%
Change
Year To Date
YTD
% Change
1700
+ 7.0%17,914- 6.9%
2198
+ 11.4%25,219- 0.2%
4353
+ 31.4%37,485- 3.0%
1071
+ 29.2%10,344+ 2.2%
2577
- 3.8%28,754+ 38.5%
1
- 80.0%10- 94.3%
2184
+ 12.3%19,029- 13.3%
1137
+ 18.2%12,468- 0.4%
491
- 9.9%5257- 8.5%
517
- 31.7%5839- 19.3%
1154
+ 21.6%16,868+ 20.5%
1182
- 2.8%12,085- 6.4%
643
- 18.1%7076+ 4.2%
956
-----9524-----
243
- 68.2%3092- 40.1%
168
+ 21.7%1369+ 6.7%
496
+ 3.8%4191- 6.6%
392
- 25.2%5451- 8.9%
345
- 25.2%3293- 8.9%
993
- 7.0%12,446+ 7.0%
529
- 49.1%6039- 16.9%
163
+ 31.5%1511+ 1.5%
2512
+ 29.8%22,438+ 29.5%
530
+ 25.9%4905+ 8.7%

Midsize SUV
October 2012
%
Change
Year To Date
YTD
% Change
231
- 18.1%2857- 9.2%
209
- 38.7%2916- 35.5%
141
- 34.1%2130+ 2.3%
1
- 93.8%90- 79.9%
1249
+ 10.7%16,551+ 23.1%
774
- 2.8%8783+ 9.5%
101
- 19.2%2847+ 14.7%
351
+ 16.6%4254- 6.1%
725
+ 94.9%4913+ 34.7%
2184
+ 12.3%19,029- 13.3%
168
+ 5.0%1759+ 42.3%
1047
+ 3.1%8738+ 4.5%
10
- 96.6%864- 52.2%
1182
- 2.8%12,085- 6.4%
169
+ 33.1%1132+ 6.1%
2
- 97.5%111- 65.8%
214
- 18.6%3826- 3.9%
175
+ 90.2%1458- 10.4%
73
+ 49.0%753- 31.5%
34
- 32.0%319- 18.0%
255
+ 24.4%2391+ 12.3%
55
+ 12.2%564+ 7.6%
781
+ 94.3%5537+ 25.9%
203
+ 63.7%1626+ 20.7%

Monday, November 19, 2012

October 2012 Canada Small, Midsize, And Large Car Sales

2013 Buick Verano crystal red tintcoat
The methods you use to determine what makes a car a car and what makes a truck a truck will alter this number slightly, but approximately 46% of the new vehicles sold in Canada in October 2012 were passenger cars. Yes, by common standards the Mini Countryman is a truck, but the majority of vehicles which sit on the fence are low volume models. The 46% number, which if I keep saying will soon make me sound like Mitt Romney, doesn't change much without seriously redifining the car/truck border.

Canada small car sales chart October 2012
Small Car Sales Chart
Click Any Chart For A Larger View
So while it's true that the definition of light truck is much more welcoming and thus includes many nameplates that are definitely not pickups, there are most definitely no trucks on the car list. And cars are not the better sellers in Canada. The Honda Civic, Canada's best-selling car, trails two pickup trucks in the year-to-date standings of all 261 vehicles sold in Canada this year. The Dodge Grand Caravan, technically a light truck, slots in ahead of the next-best-selling car, Hyundai's Elantra. And only 14 of Canada's 30 best-selling vehicles are wholehearted passenger cars.

Consider a few automakers as extreme examples of the norm. Buick cars accounted for just 4% of all General Motors sales in October. The Verano, Buick's best-selling model in Canada, was responsible for 47.7% of all Buick sales.

Canada october 2012 midsize car sales chart
Midsize Car Sales Chart
Cars only brought in 15% of all Chrysler Canada sales last month. The 200, Chrysler Canada's best-selling car, was the company's sixth-best-selling nameplate. (The Dart was Chrysler Canada's second-ranked car in October.)

Car sales at Ford were worth less than a quarter of the Blue Oval's October volume in Canada.  Ford's F-Series pickup truck outsold the car division by 3141 units.

Think this is just a domestic thing? It is, mostly. But cars - which basically means the Lancer - accounted for just 43% of Mitsubishi's October volume, although the Lancer is the company's top seller. The Rogue crossover, technically not a car, is Nissan's most popular vehicle in Canada.

At Honda, however, the Civic, Accord, and Fit brought in 52% of Honda's October sales. Just under half of all the Mazdas sold in Canada last month were 3 sedans and hatchbacks. The majority of Nissans sold in Canada are in fact cars. And 52% of the vehicles sold by Toyota in October were Camrys, Corollas, Matrixes, Prius variants, and Yaris sedans and hatchbacks.


Canada large car sales chart October 2012
Large Car Sales Chart
The tables visible after the jump break down Canada's October 2012 passenger car situation with detailed year-over-year and year-to-date sales figures. We've added the Hyundai Veloster to the small car table but will keep showcasing it with sporty cars, as well. 

This is where we tirelessly point out that historic brand and corporate totals (monthly and yearly going back to 2004) are now available through the dropdown menu at GCBC's Sales Stats page, along with results for more than 260 currently sold vehicles. That's where you'll find out, for example, that while Ford F-Series sales have been steadily falling with the market's decline south of the border, they've been steadily rising in Canada over the last decade or so.

If the vehicle you're looking for isn't grouped with these vehicles, it may be listed in the small/entry luxury car category, the sporty car category, or any other segment you can access through the eighth dropdown menu on GCBC's Tally page.

Small Car
October 2012
%
Change
Year To Date
YTD
% Change
498
-----4379-----
3069
+ 22.1%28,370- 4.7%
4
- 94.6%170- 84.7%
747
- 6.0%8011+ 26.0%
75
-----280-----
-----
- 100%280- 94.0%
708
-----1787-----
474
+ 17.0%7603+ 59.4%
746
- 0.5%10,621- 8.4%
2409
+ 49.9%24,179+ 7.3%
5041
+ 1.3%53,235+ 24.5%
461
+ 192%4004+ 47.3%
1303
- 26.0%20,760+ 6.1%
4276
+ 25.8%43,661+ 9.0%
394
- 7.3%5025+ 404%
1195
+ 23.8%13,647+ 8.5%
801
+ 69.7%11,910+ 105%
536
- 46.3%6751- 35.1%
341
- 41.6%4528- 44.1%
2508
- 11.3%34,888+ 10.4%
368
+ 25.6%4011+ 37.5%
10
-----175-----
600
+ 70.9%6200+ 12.6%
23
- 34.3%286- 25.7%
540
- 29.4%9076- 20.8%
1480
+ 36.5%11,368- 8.3%
121
-----889-----
90
- 36.6%955- 25.6%
60
- 14.3%547- 45.9%
167
+ 70.4%2035+ 31.9%
914
+ 170%9491+ 53.5%
529
-----1149-----
308
+ 15.8%2575+ 4.1%
3518
+ 0.3%35,559+ 14.3%
1006
- 38.0%11,659- 7.7%
119
-----2193-----
1076
+ 86.5%9669+ 49.6%
135
+ 6650%1796+ 780%
1298
+ 24.9%11,794- 2.6%
2821
+ 21.7%22,511- 3.3%

Midsize Car
October 2012
%
Change
Year To Date
YTD
% Change
149
- 41.1%1553- 33.8%
534
- 6.3%4846- 51.5%
148
+ 106%1075+ 400%
878
+ 109%12,658+ 100%
231
- 28.7%4316- 1.9%
17
-----22-----
1272
- 3.3%14,588- 12.0%
1565
+ 177%7278+ 4.6%
128
+ 113%873+ 1.5%
26
+ 550%141- 39.2%
1042
- 18.3%12,832- 12.2%
913
+ 233%10,722+ 652%
548
+ 77.9%3904+ 22.5%
841
+ 49.6%11,570+ 6.7%
10
- 63.0%206+ 199%
238
- 13.5%2192- 18.8%
722
+ 18.2%5865- 1.4%
74
+ 68.2%593- 6.8%
1435
+ 60.2516,094+ 68.0%
326
+ 93.0%2961+ 110%
316
+ 87.0% 2930 + 108%
10
----- 31 -----
328
+ 993%3523+ 11,643%
1030
- 28.1%9642- 11.4%
700
+ 6.2%6923+ 217%