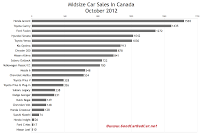
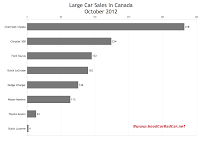
The methods you use to determine what makes a car a car and what makes a truck a truck will alter this number slightly, but approximately 46% of the new vehicles sold in Canada in October 2012 were passenger cars. Yes, by common standards the Mini Countryman is a truck, but the majority of vehicles which sit on the fence are low volume models. The 46% number, which if I keep saying will soon make me sound like Mitt Romney, doesn't change much without seriously redifining the car/truck border.
So while it's true that the definition of light truck is much more welcoming and thus includes many nameplates that are definitely not pickups, there are most definitely no trucks on the car list. And cars are not the better sellers in Canada. The Honda Civic, Canada's best-selling car, trails two pickup trucks in the year-to-date standings of all 261 vehicles sold in Canada this year. The Dodge Grand Caravan, technically a light truck, slots in ahead of the next-best-selling car, Hyundai's Elantra. And only 14 of Canada's 30 best-selling vehicles are wholehearted passenger cars.
Consider a few automakers as extreme examples of the norm. Buick cars accounted for just 4% of all General Motors sales in October. The Verano, Buick's best-selling model in Canada, was responsible for 47.7% of all Buick sales.
Cars only brought in 15% of all Chrysler Canada sales last month. The 200, Chrysler Canada's best-selling car, was the company's sixth-best-selling nameplate. (The Dart was Chrysler Canada's second-ranked car in October.)
Car sales at Ford were worth less than a quarter of the Blue Oval's October volume in Canada. Ford's F-Series pickup truck outsold the car division by 3141 units.
Think this is just a domestic thing? It is, mostly. But cars - which basically means the Lancer - accounted for just 43% of Mitsubishi's October volume, although the Lancer is the company's top seller. The Rogue crossover, technically not a car, is Nissan's most popular vehicle in Canada.
At Honda, however, the Civic, Accord, and Fit brought in 52% of Honda's October sales. Just under half of all the Mazdas sold in Canada last month were 3 sedans and hatchbacks. The majority of Nissans sold in Canada are in fact cars. And 52% of the vehicles sold by Toyota in October were Camrys, Corollas, Matrixes, Prius variants, and Yaris sedans and hatchbacks.
The tables visible after the jump break down Canada's October 2012 passenger car situation with detailed year-over-year and year-to-date sales figures. We've added the Hyundai Veloster to the small car table but will keep showcasing it with sporty cars, as well.
This is where we tirelessly point out that historic brand and corporate totals (monthly and yearly going back to 2004) are now available through the dropdown menu at GCBC's Sales Stats page, along with results for more than 260 currently sold vehicles. That's where you'll find out, for example, that while Ford F-Series sales have been steadily falling with the market's decline south of the border, they've been steadily rising in Canada over the last decade or so.
If the vehicle you're looking for isn't grouped with these vehicles, it may be listed in the small/entry luxury car category, the sporty car category, or any other segment you can access through the eighth dropdown menu on GCBC's Tally page.
 |
| Small Car Sales Chart Click Any Chart For A Larger View |
Consider a few automakers as extreme examples of the norm. Buick cars accounted for just 4% of all General Motors sales in October. The Verano, Buick's best-selling model in Canada, was responsible for 47.7% of all Buick sales.
 |
| Midsize Car Sales Chart |
Car sales at Ford were worth less than a quarter of the Blue Oval's October volume in Canada. Ford's F-Series pickup truck outsold the car division by 3141 units.
Think this is just a domestic thing? It is, mostly. But cars - which basically means the Lancer - accounted for just 43% of Mitsubishi's October volume, although the Lancer is the company's top seller. The Rogue crossover, technically not a car, is Nissan's most popular vehicle in Canada.
At Honda, however, the Civic, Accord, and Fit brought in 52% of Honda's October sales. Just under half of all the Mazdas sold in Canada last month were 3 sedans and hatchbacks. The majority of Nissans sold in Canada are in fact cars. And 52% of the vehicles sold by Toyota in October were Camrys, Corollas, Matrixes, Prius variants, and Yaris sedans and hatchbacks.
 |
| Large Car Sales Chart |
This is where we tirelessly point out that historic brand and corporate totals (monthly and yearly going back to 2004) are now available through the dropdown menu at GCBC's Sales Stats page, along with results for more than 260 currently sold vehicles. That's where you'll find out, for example, that while Ford F-Series sales have been steadily falling with the market's decline south of the border, they've been steadily rising in Canada over the last decade or so.
If the vehicle you're looking for isn't grouped with these vehicles, it may be listed in the small/entry luxury car category, the sporty car category, or any other segment you can access through the eighth dropdown menu on GCBC's Tally page.
Small Car | October 2012 | % Change | Year To Date | YTD % Change |
498 | ----- | 4379 | ----- | |
3069 | + 22.1% | 28,370 | - 4.7% | |
4 | - 94.6% | 170 | - 84.7% | |
747 | - 6.0% | 8011 | + 26.0% | |
75 | ----- | 280 | ----- | |
----- | - 100% | 280 | - 94.0% | |
708 | ----- | 1787 | ----- | |
474 | + 17.0% | 7603 | + 59.4% | |
746 | - 0.5% | 10,621 | - 8.4% | |
2409 | + 49.9% | 24,179 | + 7.3% | |
5041 | + 1.3% | 53,235 | + 24.5% | |
461 | + 192% | 4004 | + 47.3% | |
1303 | - 26.0% | 20,760 | + 6.1% | |
4276 | + 25.8% | 43,661 | + 9.0% | |
394 | - 7.3% | 5025 | + 404% | |
1195 | + 23.8% | 13,647 | + 8.5% | |
801 | + 69.7% | 11,910 | + 105% | |
536 | - 46.3% | 6751 | - 35.1% | |
341 | - 41.6% | 4528 | - 44.1% | |
2508 | - 11.3% | 34,888 | + 10.4% | |
368 | + 25.6% | 4011 | + 37.5% | |
10 | ----- | 175 | ----- | |
600 | + 70.9% | 6200 | + 12.6% | |
23 | - 34.3% | 286 | - 25.7% | |
540 | - 29.4% | 9076 | - 20.8% | |
1480 | + 36.5% | 11,368 | - 8.3% | |
121 | ----- | 889 | ----- | |
90 | - 36.6% | 955 | - 25.6% | |
60 | - 14.3% | 547 | - 45.9% | |
167 | + 70.4% | 2035 | + 31.9% | |
914 | + 170% | 9491 | + 53.5% | |
529 | ----- | 1149 | ----- | |
308 | + 15.8% | 2575 | + 4.1% | |
3518 | + 0.3% | 35,559 | + 14.3% | |
1006 | - 38.0% | 11,659 | - 7.7% | |
119 | ----- | 2193 | ----- | |
1076 | + 86.5% | 9669 | + 49.6% | |
135 | + 6650% | 1796 | + 780% | |
1298 | + 24.9% | 11,794 | - 2.6% | |
2821 | + 21.7% | 22,511 | - 3.3% |
Midsize Car | October 2012 | % Change | Year To Date | YTD % Change |
149 | - 41.1% | 1553 | - 33.8% | |
534 | - 6.3% | 4846 | - 51.5% | |
148 | + 106% | 1075 | + 400% | |
878 | + 109% | 12,658 | + 100% | |
231 | - 28.7% | 4316 | - 1.9% | |
17 | ----- | 22 | ----- | |
1272 | - 3.3% | 14,588 | - 12.0% | |
1565 | + 177% | 7278 | + 4.6% | |
128 | + 113% | 873 | + 1.5% | |
26 | + 550% | 141 | - 39.2% | |
1042 | - 18.3% | 12,832 | - 12.2% | |
913 | + 233% | 10,722 | + 652% | |
548 | + 77.9% | 3904 | + 22.5% | |
841 | + 49.6% | 11,570 | + 6.7% | |
10 | - 63.0% | 206 | + 199% | |
238 | - 13.5% | 2192 | - 18.8% | |
722 | + 18.2% | 5865 | - 1.4% | |
74 | + 68.2% | 593 | - 6.8% | |
1435 | + 60.25 | 16,094 | + 68.0% | |
326 | + 93.0% | 2961 | + 110% | |
316 | + 87.0% | 2930 | + 108% | |
10 | ----- | 31 | ----- | |
328 | + 993% | 3523 | + 11,643% | |
1030 | - 28.1% | 9642 | - 11.4% | |
700 | + 6.2% | 6923 | + 217% |
Large Car | October 2012 | % Change | Year To Date | YTD % Change |
162 | - 9.5% | 2133 | - 14.2% | |
4 | - 96.3% | 556 | - 71.7% | |
418 | + 57.1% | 7003 | - 17.4% | |
224 | - 58.7% | 5242 | + 105% | |
136 | - 49.8% | 3599 | - 4.5% | |
172 | + 11.7% | 4507 | + 57.3% | |
115 | - 0.9% | 1899 | + 5.4% | |
24 | - 60.7% | 305 | - 25.2% |
Related From GoodCarBadCar.net
Small, Midsize & Large Car Sales In Canada - November 2012
Small, Midsize & Large Car Sales In Canada - September 2012
Small, Midsize & Large Car Sales In Canada - October 2011
Top 20 Best-Selling Cars In Canada - October 2012
Canada Auto Sales Brand Rankings - October 2012
Small, Midsize & Large SUV Sales In Canada - October 2012

No comments:
Post a Comment