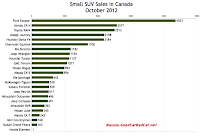
Earlier this morning we explored the subject of Canada's non-car-oriented vehicle market. Canada's best-selling cars are easily more popular than Canada's top-selling crossovers and SUVs, but the growth many small crossovers enjoyed in October 2012 was something to behold. As the overall vehicle market recorded a 7.8% year-over-year improvement last month, some two dozen mainstream brand SUVs and crossovers exceeded that figure.
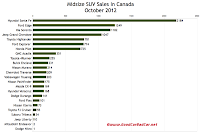
From the Ford Escape's 1040-unit increase, a 31% jump, to the Toyota Sequoia's 15-unit increase, which translated to a 26% improvement, a wide variety of utility vehicles posted meaningful advancements. Toyota sold 576 more RAV4s this October than a year ago. GMC sold 242 more Terrains. Jeep sold 205 more Wranglers; Hyundai an extra 240 Santa Fes; Honda 353 more Pilots; Toyota another 379 Highlanders.
Year-to-date, SUVs of one kind or another are the sixth, 11th, 13th, 16th, 18th, 19th, 20th, and 21st-best-selling vehicles in Canada when compared with all other vehicle types. 2011 ended with SUVs as the seventh, 12th, 15th, 16th, 17th, 19th, 23rd, and 24th-best-selling vehicles in Canada. Too many numbers? Put simply, Canada's eight leading utility vehicles rank higher this year than they did last year.
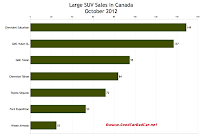
Not all SUV types are vital to the health of Canada's auto industry. The seven full-size SUVs in the table at the bottom of this post and in the accompanying chart accounted for less than one half of one percent of the overall new vehicle market in October.
However, Canada's seven most popular utility vehicles in October - the Ford Escape, Honda CR-V, Toyota RAV4, Dodge Journey, Hyundai Santa Fe, Chevrolet Equinox, and Ford Edge - accounted for 12.4% of the market. (For some perspective, consider that Canada's seven most popular cars accounted for 17.4% of the market.)
The tables visible after the jump break down Canada's October 2012 SUV/CUV situation with detailed year-over-year and year-to-date sales figures. The Volkswagen Touareg has been added to the midsize SUV table but we'll also be showing it with the more similarly-priced midsize luxury SUVs.
This is where we tirelessly point out that historic brand and corporate totals (monthly and yearly going back to 2004) are now available through the dropdown menu at GCBC's Sales Stats page, along with results for more than 260 currently sold vehicles. That's where you'll find out that
If the vehicle you're looking for isn't grouped together with these SUVs, it may be listed with cars, with luxury SUVs, or in one of the other segments you can access through the eighth dropdown menu on GCBC's Tally page.
Source: Manufacturers & ANDC
Related From GoodCarBadCar.net
Small, Midsize & Large SUV Sales In Canada - November 2012
Small, Midsize & Large SUV Sales In Canada - September 2012
Small, Midsize & Large SUV Sales In Canada - October 2011
Top 20 Best-Selling SUVs In Canada - October 2012
Canada Auto Sales Brand Rankings - October 2012
Small, Midsize & Large Car Sales In Canada - October 2012
 |
| Small SUV Sales Chart Click Any Chart For A Larger View |
Year-to-date, SUVs of one kind or another are the sixth, 11th, 13th, 16th, 18th, 19th, 20th, and 21st-best-selling vehicles in Canada when compared with all other vehicle types. 2011 ended with SUVs as the seventh, 12th, 15th, 16th, 17th, 19th, 23rd, and 24th-best-selling vehicles in Canada. Too many numbers? Put simply, Canada's eight leading utility vehicles rank higher this year than they did last year.
 |
| Midsize SUV Sales Chart |
However, Canada's seven most popular utility vehicles in October - the Ford Escape, Honda CR-V, Toyota RAV4, Dodge Journey, Hyundai Santa Fe, Chevrolet Equinox, and Ford Edge - accounted for 12.4% of the market. (For some perspective, consider that Canada's seven most popular cars accounted for 17.4% of the market.)
The tables visible after the jump break down Canada's October 2012 SUV/CUV situation with detailed year-over-year and year-to-date sales figures. The Volkswagen Touareg has been added to the midsize SUV table but we'll also be showing it with the more similarly-priced midsize luxury SUVs.
 |
| Large SUV Sales Chart |
If the vehicle you're looking for isn't grouped together with these SUVs, it may be listed with cars, with luxury SUVs, or in one of the other segments you can access through the eighth dropdown menu on GCBC's Tally page.
Small SUV | October 2012 | % Change | Year To Date | YTD % Change |
1700 | + 7.0% | 17,914 | - 6.9% | |
2198 | + 11.4% | 25,219 | - 0.2% | |
4353 | + 31.4% | 37,485 | - 3.0% | |
1071 | + 29.2% | 10,344 | + 2.2% | |
2577 | - 3.8% | 28,754 | + 38.5% | |
1 | - 80.0% | 10 | - 94.3% | |
2184 | + 12.3% | 19,029 | - 13.3% | |
1137 | + 18.2% | 12,468 | - 0.4% | |
491 | - 9.9% | 5257 | - 8.5% | |
517 | - 31.7% | 5839 | - 19.3% | |
1154 | + 21.6% | 16,868 | + 20.5% | |
1182 | - 2.8% | 12,085 | - 6.4% | |
643 | - 18.1% | 7076 | + 4.2% | |
956 | ----- | 9524 | ----- | |
243 | - 68.2% | 3092 | - 40.1% | |
168 | + 21.7% | 1369 | + 6.7% | |
496 | + 3.8% | 4191 | - 6.6% | |
392 | - 25.2% | 5451 | - 8.9% | |
345 | - 25.2% | 3293 | - 8.9% | |
993 | - 7.0% | 12,446 | + 7.0% | |
529 | - 49.1% | 6039 | - 16.9% | |
163 | + 31.5% | 1511 | + 1.5% | |
2512 | + 29.8% | 22,438 | + 29.5% | |
530 | + 25.9% | 4905 | + 8.7% |
Midsize SUV | October 2012 | % Change | Year To Date | YTD % Change |
231 | - 18.1% | 2857 | - 9.2% | |
209 | - 38.7% | 2916 | - 35.5% | |
141 | - 34.1% | 2130 | + 2.3% | |
1 | - 93.8% | 90 | - 79.9% | |
1249 | + 10.7% | 16,551 | + 23.1% | |
774 | - 2.8% | 8783 | + 9.5% | |
101 | - 19.2% | 2847 | + 14.7% | |
351 | + 16.6% | 4254 | - 6.1% | |
725 | + 94.9% | 4913 | + 34.7% | |
2184 | + 12.3% | 19,029 | - 13.3% | |
168 | + 5.0% | 1759 | + 42.3% | |
1047 | + 3.1% | 8738 | + 4.5% | |
10 | - 96.6% | 864 | - 52.2% | |
1182 | - 2.8% | 12,085 | - 6.4% | |
169 | + 33.1% | 1132 | + 6.1% | |
2 | - 97.5% | 111 | - 65.8% | |
214 | - 18.6% | 3826 | - 3.9% | |
175 | + 90.2% | 1458 | - 10.4% | |
73 | + 49.0% | 753 | - 31.5% | |
34 | - 32.0% | 319 | - 18.0% | |
255 | + 24.4% | 2391 | + 12.3% | |
55 | + 12.2% | 564 | + 7.6% | |
781 | + 94.3% | 5537 | + 25.9% | |
203 | + 63.7% | 1626 | + 20.7% |
Large SUV | October 2012 | % Change | Year To Date | YTD % Change |
149 | - 2.6% | 811 | - 22.8% | |
84 | + 12.0% | 946 | + 0.5% | |
53 | - 56.9% | 1476 | + 3.6% | |
95 | + 8.0% | 914 | + 4.6% | |
137 | - 2.1% | 879 | + 2.1% | |
25 | - 49.0% | 471 | - 8.4% | |
72 | + 26.3% | 591 | + 1.4% |
Related From GoodCarBadCar.net
Small, Midsize & Large SUV Sales In Canada - November 2012
Small, Midsize & Large SUV Sales In Canada - September 2012
Small, Midsize & Large SUV Sales In Canada - October 2011
Top 20 Best-Selling SUVs In Canada - October 2012
Canada Auto Sales Brand Rankings - October 2012
Small, Midsize & Large Car Sales In Canada - October 2012

No comments:
Post a Comment