 |
| Small SUV Sales Chart Click Any Chart For Larger View |
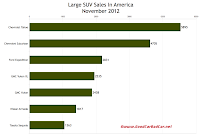
Don't thank full-size sport-utility vehicles for any of the industry's good fortunes this year. America's seven full-size, truck-based, mainstream brand SUVs found 231,688 buyers in the first eleven months of 2011 but only 208,393 in the first eleven months of 2012. That equals an 11.2% drop. Again, this didn't occur in a stagnant automobile market but in a thriving, growing, burgeoning market.
 |
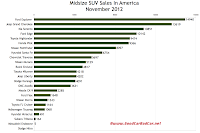
| Midsize SUV Sales Chart |
The worst large SUV declines? GMC Yukon sales are down 21.2%; 6406 lost sales. Its twin, the Chevrolet Tahoe, is down 16.4%, equal to 11,795 lost sales. You've heard about GM's scant 3.5% sales improvement this year? If we exclude the two big Chevy SUVs and two big GMCs from the conversation, General Motors sales are up 4.8% in 2012.
 |
| Large SUV Sales Chart |
Click any of the three accompanying charts for a larger view. In those charts, SUVs are ranked by volume - they're listed alphabetically in the tables below.
Small SUV | November 2012 | % Change | Year To Date | YTD % Change |
3672 | + 26.0% | 34,228 | + 577% | |
16,821 | + 12.6% | 199,070 | + 13.7% | |
6569 | + 77.0% | 71,875 | + 42.5% | |
20,970 | - 3.9% | 240,877 | + 5.3% | |
8158 | + 44.3% | 86,270 | + 14.3% | |
22,333 | + 36.0% | 255,919 | + 30.0% | |
6754 | + 10.2% | 63,737 | - 8.0% | |
3838 | - 6.4% | 45,133 | + 5.5% | |
2715 | - 36.3% | 37,104 | - 14.6% | |
4174 | + 4.0% | 57,444 | + 14.3% | |
10,337 | + 12.1% | 130,124 | + 17.2% | |
10,851 | + 12.2% | 108,630 | - 9.2% | |
2269 | - 29.5% | 34,661 | - 20.9% | |
4213 | ----- | 37,363 | ----- | |
----- | - 100% | 11,327 | - 65.6% | |
1608 | + 13.9% | 18,788 | + 27.8% | |
585 | - 15.8% | 7112 | - 19.6% | |
1520 | + 34.2% | 16,321 | + 9.5% | |
3003 | + 19.5% | 33,619 | + 2.3% | |
12,662 | + 16.8% | 130,861 | + 16.6% | |
5703 | - 2.2% | 67,583 | - 0.02% | |
333 | - 19.2% | 4616 | + 2.4% | |
12,423 | + 9.6% | 157,526 | + 33.3% | |
2815 | + 52.2% | 28,421 | + 20.5% |
Midsize SUV | November 2012 | % Change | Year To Date | YTD % Change |
4817 | + 22.8% | 50,651 | - 4.1% | |
5697 | - 20.3% | 78,176 | - 20.1% | |
4091 | + 3.6% | 37,373 | - 20.3% | |
----- | - 100% | 3269 | - 85.4% | |
10,142 | + 4.7% | 115,535 | + 5.4% | |
14,940 | + 15.9% | 146,963 | + 20.6% | |
1648 | - 23.8% | 26,052 | + 3.5% | |
3631 | - 25.7% | 73,101 | + 1.6% | |
9366 | - 10.7% | 103,482 | - 1.1% | |
6754 | + 10.2% | 63,737 | - 8.0% | |
491 | - 51.8% | 8174 | - 5.0% | |
13,619 | + 0.5% | 137,613 | + 24.7% | |
4202 | - 19.2% | 71,975 | + 18.9% | |
10,851 | + 12.2% | 108,630 | - 9.2% | |
2285 | - 14.2% | 21,089 | - 30.2% | |
5 | - 96.6% | 493 | - 94.8% | |
5129 | + 5.2% | 47,676 | - 1.0% | |
8097 | + 249% | 34,682 | + 49.0% | |
1343 | - 17.9% | 15,843 | - 2.5% | |
164 | - 29.0% | 1886 | - 23.6% | |
4218 | + 14.1% | 43,531 | + 9.1% | |
1164 | + 17.7% | 12,145 | - 2.4% | |
9474 | + 13.2% | 108,864 | + 21.7% | |
1068 | + 27.1% | 9145 | + 42.5% |
Large SUV | November 2012 | % Change | Year To Date | YTD % Change |
4705 | - 18.7% | 42,160 | - 3.1% | |
5895 | - 29.8% | 60,302 | - 16.4% | |
2831 | - 14.0% | 34,001 | - 6.3% | |
2438 | - 18.4% | 23,876 | - 21.2% | |
2535 | - 8.7% | 20,498 | - 7.0% | |
1817 | + 2.1% | 15,938 | - 2.7% | |
1363 | + 4.5% | 11,618 | + 4.7% |
Related From GoodCarBadCar.net
Small, Midsize & Large SUV Sales In America - December & 2012 Year End
U.S. Small, Midsize & Large SUV Sales - October 2012
U.S. Small, Midsize & Large SUV Sales - November 2011
Top 20 Best-Selling SUVs In America - November 2012
U.S. Auto Sales Brand Rankings - November 2012

No comments:
Post a Comment