 |
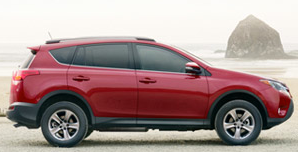
| Toyota's Recently Revamped 2013 Toyota RAV4 |
As much as the North American new vehicle market has grown this year (up 6.5% through eleven months), growth in this category is not a matter of course.
 |
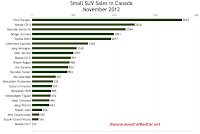
| Small SUV Sales Chart Click Any Chart For Larger View |
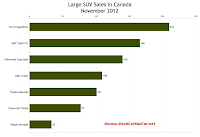
Four of the seven SUVs in the table at the bottom of this post have suffered year-over-year declines in 2012. The best-selling Ford Expedition is up 8%. The worst-selling Nissan Armada is down 9%. Twins behave similarly? Sales of the identical GMC Yukon and Chevrolet Tahoe stand at 1023 units through eleven months.
 |
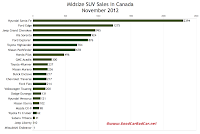
| Midsize SUV Sales Chart |
For all the Tahoes and Suburans and Yukons General Motors sells in Canada, the company sells 7.6 copies of the Equinox and Terrain.
The Nissan Rogue is nearly 27 times more likely to be sold than the Nissan Armada. Toyota's RAV4 is 35 times more popular than the Sequoia.
That should offer some perspective. Small SUVs and crossovers account for 19% of all new vehicle sales in Canada this year.
 |
| Large SUV Sales Chart |
Click any of the accompanying charts for a larger view. In those charts, SUVs are ranked by volume - they're listed alphabetically in the tables below.
Small SUV | November 2012 | % Change | Year To Date | YTD % Change |
1428 | - 11.6% | 19,342 | - 7.3% | |
2091 | + 13.3% | 27,310 | + 0.8% | |
3833 | + 46.7% | 41,318 | + 0.2% | |
1057 | + 21.6% | 11,401 | + 3.8% | |
2626 | + 7.5% | 31,380 | + 35.2% | |
2394 | + 97.5% | 21,423 | - 7.5% | |
904 | - 12.5% | 13,372 | - 1.3% | |
445 | - 7.1% | 5702 | - 8.4% | |
443 | - 35.2% | 6282 | - 20.7% | |
1140 | + 33.2% | 18,008 | + 21.2% | |
924 | - 25.5% | 13,009 | - 8.1% | |
607 | - 2.6% | 7683 | + 3.7% | |
991 | ----- | 10,515 | ----- | |
10 | - 98.9% | 3102 | - 48.8% | |
185 | + 27.6% | 1554 | + 8.8% | |
532 | - 8.4% | 4723 | - 6.8% | |
485 | - 11.2% | 5936 | - 9.1% | |
256 | - 52.3% | 3549 | - 14.5% | |
960 | - 19.5% | 13,406 | + 4.6% | |
507 | - 39.0% | 6546 | - 19.1% | |
166 | - 1.2% | 1677 | + 1.3% | |
2017 | + 4.0% | 24,455 | + 26.9% | |
476 | + 14.1% | 5381 | + 9.2% |
Midsize SUV | November 2012 | % Change | Year To Date | YTD % Change |
217 | - 17.5% | 3074 | - 9.8% | |
217 | - 26.9% | 3133 | - 35.0% | |
131 | - 28.4% | 2261 | - 0.2% | |
1275 | + 21.3% | 17,826 | + 22.9% | |
876 | + 19.8% | 9659 | + 10.4% | |
214 | + 25.1% | 3061 | + 15.3% | |
300 | - 11.2% | 4554 | - 6.5% | |
496 | + 29.2% | 5409 | + 34.2% | |
2394 | + 97.5% | 21,423 | - 7.5% | |
121 | - 28.0% | 1880 | + 33.9% | |
995 | + 2.3% | 9733 | + 4.3% | |
10 | - 87.5% | 874 | - 53.7% | |
924 | - 25.5% | 13,009 | - 8.1% | |
98 | + 14.0% | 1230 | + 6.7% | |
1 | - 98.5% | 112 | - 71.4% | |
236 | - 45.1% | 4062 | - 7.9% | |
678 | + 505% | 2136 | + 22.8% | |
102 | + 15.9% | 855 | - 28.0% | |
31 | - 24.4% | 350 | - 18.6% | |
237 | + 12.9% | 2628 | + 12.4% | |
62 | + 19.2% | 626 | + 8.7% | |
704 | + 4.8% | 6241 | + 23.1% | |
200 | + 24.2% | 1826 | + 21.1% |
Large SUV | November 2012 | % Change | Year To Date | YTD % Change |
140 | + 11.1% | 951 | - 19.1% | |
77 | - 35.3% | 1023 | - 3.5% | |
210 | + 56.7% | 1686 | + 8.1% | |
109 | - 9.9% | 1023 | + 2.8% | |
166 | - 19.0% | 1045 | - 2.0% | |
33 | - 17.5% | 504 | - 9.0% | |
101 | + 34.7% | 692 | + 5.2% |
Related From GoodCarBadCar.net
Small SUV Sales In Canada - December & 2012 Year End
Midsize & Large SUV Sales In Canada - December & 2012 Year End
Small, Midsize & Large SUV Sales In Canada - October 2012
Small, Midsize & Large SUV Sales In Canada - November 2011
Top 20 Best-Selling SUVs In Canada - November 2012
Canada Auto Sales Brand Rankings - November 2012
No comments:
Post a Comment