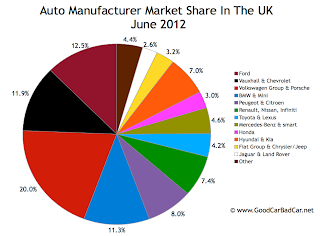
Collectively, residents of the United Kingdom acquired 189,514 new vehicles in June 2012. Ford led the way with 23,654 of those sales. However, the Volkswagen Group - which includes high-volume brands like Audi, Skoda, and Seat - accounted for one out of every five cars sold. Overall, VW's market share in June was 7.5 percentage points beyond Ford's.
Yet it was Ford, not Volkswagen, which landed its car atop the standings in today's earlier best-selling cars post. The Fiesta is responsible for 38.3% of all Ford UK sales. Not available as a three-door in the United States where it's part of a very different lineup, the Fiesta accounted for 2.3% of Ford's U.S. volume in June.
Overall, the UK car market grew 3.5% in June 2012 and is up 2.7% this year. In June, no mainstream automaker fell harder than Renault, a brand which has lost much of its fleet in the United Kingdom.
Not surprisingly, Honda sales rose sharply after the brand suffered from low inventory in June 2011. Honda remains a relatively small part of the UK industry. BMW sold more copies of the 3-Series in June than Honda sold cars in total.
BMW, by the way, was the best-selling luxury car brand in the UK in June. Therefore Audi leads the standings year-to-date by a smaller margin at the halfway point, just 1491 units.
The UK loves its home market products, inordinately so, thus Land Rover sales continue to rise. For the tenth consecutive month, Land Rover posted a year-over-year increase. Jaguar, though down 5% last month, continues to grab decent market share compared with what happens elsewhere. 0.4% of all new vehicle sales in the UK in June were Jaguars. In the United States, Jaguar's market share in June was just 0.08%.
All 43 brands are ranked by June 2012 volume in the table below. Last month's version can be viewed here, last year's here, and the U.S. and Canadian versions here and here, respectively. Click the chart above for market share figures.
Source: Automakers & SMMT
Yet it was Ford, not Volkswagen, which landed its car atop the standings in today's earlier best-selling cars post. The Fiesta is responsible for 38.3% of all Ford UK sales. Not available as a three-door in the United States where it's part of a very different lineup, the Fiesta accounted for 2.3% of Ford's U.S. volume in June.
Overall, the UK car market grew 3.5% in June 2012 and is up 2.7% this year. In June, no mainstream automaker fell harder than Renault, a brand which has lost much of its fleet in the United Kingdom.
Not surprisingly, Honda sales rose sharply after the brand suffered from low inventory in June 2011. Honda remains a relatively small part of the UK industry. BMW sold more copies of the 3-Series in June than Honda sold cars in total.
BMW, by the way, was the best-selling luxury car brand in the UK in June. Therefore Audi leads the standings year-to-date by a smaller margin at the halfway point, just 1491 units.
The UK loves its home market products, inordinately so, thus Land Rover sales continue to rise. For the tenth consecutive month, Land Rover posted a year-over-year increase. Jaguar, though down 5% last month, continues to grab decent market share compared with what happens elsewhere. 0.4% of all new vehicle sales in the UK in June were Jaguars. In the United States, Jaguar's market share in June was just 0.08%.
All 43 brands are ranked by June 2012 volume in the table below. Last month's version can be viewed here, last year's here, and the U.S. and Canadian versions here and here, respectively. Click the chart above for market share figures.
Rank | Automaker | June 2012 | % Change | Year To Date | YTD % Change |
#1 | Ford | 23,654 | - 3.3% | 150,378 | + 4.1% |
#2 | Vauxhall | 21,334 | - 9.7% | 115,932 | - 9.0% |
#3 | Volkswagen | 17,121 | + 4.1% | 95,805 | + 1.6% |
#4 | BMW | 14,302 | + 15.2% | 64,514 | + 6.5% |
#5 | Audi | 10,936 | + 2.2% | 66,005 | + 6.6% |
#6 | Nissan | 10,818 | + 23.5% | 53,977 | + 10.9% |
#7 | Peugeot | 8708 | - 8.1% | 52,482 | + 2.4% |
#8 | Mercedes-Benz | 8211 | + 11.0% | 47,790 | + 14.6% |
#9 | Hyundai | 7362 | + 37.6% | 35,168 | + 11.4% |
#10 | Mini | 7151 | + 20.9% | 24,614 | - 0.02% |
#11 | Toyota | 7098 | + 25.3% | 45,299 | + 18.2% |
#12 | Citroen | 6381 | + 1.9% | 37,330 | + 3.7% |
#13 | Kia | 5971 | + 17.2% | 33,478 | + 22.7% |
#14 | Honda | 5726 | + 73.1% | 27,511 | + 5.7% |
#15 | Skoda | 5463 | + 7.2% | 28,076 | + 15.9% |
#16 | Fiat | 4678 | - 1.3% | 25,485 | + 10.2% |
#17 | Land Rover | 3772 | + 46.0% | 26,075 | + 30.6% |
#18 | Seat | 3431 | + 11.7% | 19,186 | + 3.7% |
#19 | Volvo | 3146 | - 2.8% | 17,297 | - 3.0% |
#20 | Renault | 3099 | - 57.0% | 19,575 | - 46.8% |
#21 | Suzuki | 2200 | + 31.7% | 12,768 | + 20.5% |
#22 | Mazda | 2077 | - 38.2% | 15,034 | - 13.9% |
#23 | Chevrolet | 1189 | - 8.6% | 8811 | + 26.9% |
#24 | Jaguar | 1156 | - 4.8% | 7107 | + 3.2% |
#25 | Lexus | 813 | + 39.7% | 4751 | + 15.5% |
#26 | Porsche | 771 | + 61.3% | 3939 | + 33.1% |
#27 | Alfa Romeo | 628 | - 36.4% | 4158 | - 35.9% |
#28 | smart | 507 | - 6.8% | 2682 | - 4.2% |
#29 | Mitsubishi | 457 | - 49.9% | 3549 | - 41.9% |
#30 | Chrysler | 341 | + 478% | 1606 | + 413% |
#31 | Jeep | 214 | - 10.1% | 1181 | + 12.8% |
#32 | Subaru | 145 | + 59.3% | 1234 | - 17.4% |
#33 | Bentley | 105 | - 7.1% | 663 | + 13.0% |
#34 | Abarth | 103 | - 1.0% | 607 | - 12.5% |
#35 | Aston Martin | 60 | - 25.0% | 482 | - 17.6% |
#36 | Ssangyong | 44 | + 4300% | 420 | + 4100% |
#37 | Perodua | 34 | - 24.4% | 245 | - 17.0% |
#38 | Saab | 33 | - 87.6% | 176 | - 95.0% |
#39 | Infiniti | 28 | + 211% | 296 | + 82.7% |
#40 | Maserati | 21 | - 48.8% | 171 | - 19.7% |
#41 | MG | 19 | - 60.4% | 530 | + 317% |
#42 | Proton | 17 | - 46.9% | 155 | - 46.0% |
#43 | Lotus | 3 | - 83.3% | 82 | - 62.4% |
--- | ----- | ----- | ----- | ----- | ----- |
Volkswagen Group | 37,827 | + 5.3% | 213,674 | + 5.5% | |
Ford Motor Company | 23,654 | - 3.3% | 150,378 | + 4.1% | |
General Motors (Vauxhall & Chevrolet) | 22,523 | - 9.6% | 124,743 | - 7.2% | |
BMW-Mini | 21,453 | + 17.0% | 89,128 | + 4.6% | |
PSA (Peugeot & Citroen) | 15,089 | - 4.1% | 89,812 | + 2.9% | |
RNA (Renault, Nissan & Infiniti) | 13,945 | - 12.7% | 73,848 | - 13.8% | |
Hyundai-Kia | 13,333 | + 27.6% | 68,646 | + 16.6% | |
Daimler AG | 8718 | + 9.7% | 50,472 | + 13.4% | |
Toyota UK | 7911 | + 26.7% | 50,050 | + 18.0% | |
Fiat Group & Chrysler-Jeep | 5985 | - 3.0% | 33,208 | + 4.2% | |
Honda | 5726 | + 73.1% | 27,511 | + 5.7% | |
Jaguar-Land Rover | 4928 | + 29.8% | 33,182 | + 23.6% | |
--- | ----- | ----- | ----- | ----- | ----- |
Total | 189,514 | + 3.5% | 1,057,680 | + 2.7% |
Related From GoodCarBadCar.net
UK Auto Sales By Brand - July 2012
UK Auto Sales By Brand - May 2012
UK Auto Sales By Brand - June 2012
Top 10 Best-Selling Cars In The UK - June 2012


No comments:
Post a Comment