 |
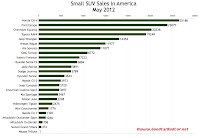
| U.S. Small SUV Sales Chart Click Any Chart For A Larger View |
It takes two GM utilities to outsell the Honda CR-V, but does it matter? How much less profit does GM earn by fitting slightly different bodywork and marketing two different nameplates? There's no denying the Equinox and Terrain have been deemed desirable, and they're not simply ending up on best seller lists with old-school GM tactics of excessive inventory and ultra-low pricing.
 |
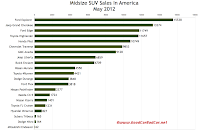
| U.S. Midsize SUV Sales Chart |
There's a good battle playing out in the midsize category between two famous American nameplates. The Ford Explorer's lead over the Jeep Grand Cherokee is now at 658 sales through five months. The Explorer beat the Grand Cherokee by 7960 units in 2011. 1570 of the Explorers sold in America since March have been Police Interceptors. Ford sold 1514 Taurus Police Interceptors during the same period.
 |
| U.S. Large SUV Sales Chart |
At the biggest end of the sport-utility vehicle spectrum, the GMC Yukon was the only mainstream brand full-size utility which sold less frequently this May than last. However, year-to-date sales of the Chevrolet Tahoe, Ford Expedition, and GMC Yukon XL have also decreased. The Good 12-winning Chevrolet Suburban is up 18% this year and posted a 16% jump in May.
Historical monthly and yearly sales figures for all these vehicles and every other automobile currently on sale in North America can be accessed through the dropdown menu at the top right of this page or at GoodCarBadCar's Sales Stats home. May 2012 updates were added on the first of June. After the jump, SUV sales are broken down by segments as judged by GoodCarBadCar. The charts you see here can be clicked for a larger view.
Small SUV | May 2012 | % Change | Year To Date | YTD % Change |
Chevrolet Captiva Sport | 3697 | ----- | 14,410 | ----- |
Chevrolet Equinox | 20,238 | + 15.1% | 90,097 | + 15.7% |
Dodge Journey | 5789 | + 56.2% | 29,855 | + 32.8% |
Ford Escape | 23,077 | - 0.3% | 98,667 | - 1.7% |
GMC Terrain | 8772 | + 20.0% | 38,807 | + 12.9% |
Honda CR-V | 25,186 | + 54.4% | 123,400 | + 29.3% |
Hyundai Santa Fe | 6884 | + 3.2% | 27,737 | + 3.4% |
Hyundai Tucson | 4644 | + 6.4% | 19,602 | + 2.5% |
Jeep Compass | 3720 | - 18.3% | 16,443 | + 2.8% |
Jeep Patriot | 5891 | + 7.7% | 27,117 | + 16.3% |
Jeep Wrangler | 14,454 | + 44.4% | 56,410 | + 34.5% |
Kia Sorento | 11,077 | - 7.2% | 46,698 | - 9.8% |
Kia Sportage | 3467 | - 23.8% | 16,632 | - 20.8% |
Mazda CX-5 | 3973 | ----- | 11,480 | ----- |
Mazda CX-7 | 1320 | - 32.7% | 9987 | - 22.9% |
Mazda Tribute | 1 | - 99.5% | 500 | - 49.9% |
Mini Countryman | 1776 | + 3.9% | 6441 | + 10.7% |
Mitsubishi Outlander | 708 | - 21.0% | 3380 | - 15.0% |
Mitsubishi Outlander Sport | 1266 | - 9.1% | 6589 | + 0.6% |
Nissan Juke | 3298 | + 66.2% | 15,627 | + 1.3% |
Nissan Rogue | 11,977 | + 72.0% | 60,839 | + 20.7% |
Subaru Forester | 7323 | + 41.0% | 29,863 | - 5.7% |
Suzuki Grand Vitara | 474 | + 25.4% | 2143 | + 0.1% |
Toyota RAV4 | 19,248 | + 123% | 74,309 | + 16.0% |
Volkswagen Tiguan | 2475 | - 19.9% | 12,055 | + 4.3% |
Midsize SUV | May 2012 | % Change | Year To Date | YTD % Change |
Buick Enclave | 6709 | + 55.2% | 22,659 | - 5.6% |
Chevrolet Traverse | 9853 | + 36.7% | 39,296 | - 9.1% |
Dodge Durango | 3848 | - 11.7% | 18,151 | + 2.3% |
Dodge Nitro | 164 | - 91.4% | 3056 | - 69.9% |
Ford Edge | 11,749 | + 23.9% | 55,177 | + 9.7% |
Ford Explorer | 15,538 | + 16.7% | 63,269 | + 14.2% |
Ford Flex | 3818 | + 40.4% | 13,349 | + 16.4% |
GMC Acadia | 9128 | + 31.8% | 32,364 | - 3.5% |
Honda Pilot | 10,749 | + 25.6% | 44,917 | + 5.5% |
Hyundai Veracruz | 827 | + 11.6% | 3112 | - 2.4% |
Jeep Grand Cherokee | 13,274 | + 40.0% | 62,611 | + 37.9% |
Jeep Liberty | 6859 | + 13.4% | 34,447 | + 32.2% |
Mazda CX-9 | 1724 | - 4.0% | 9277 | - 29.2% |
Mitsubishi Endeavor | 62 | - 71.0% | 377 | - 89.6% |
Nissan Murano | 4550 | + 34.5% | 22,702 | + 6.9% |
Nissan Pathfinder | 2377 | + 32.6% | 12,644 | + 24.8% |
Nissan Xterra | 1401 | + 0.1% | 7106 | + 8.7% |
Subaru Tribeca | 165 | - 10.3% | 907 | - 17.1% |
Toyota 4Runner | 4421 | + 36.8% | 18,258 | - 5.0% |
Toyota FJ Cruiser | 1231 | + 23.3% | 5304 | - 9.6% |
Toyota Highlander | 11,657 | + 103% | 47,065 | + 15.9% |
Large SUV | May 2012 | % Change | Year To Date | YTD % Change |
Chevrolet Suburban | 4577 | + 15.8% | 17,932 | + 17.6% |
Chevrolet Tahoe | 7169 | + 21.8% | 26,847 | - 5.9% |
Ford Expedition | 3495 | + 5.3% | 15,252 | - 2.3% |
GMC Yukon | 2504 | - 6.0% | 10,383 | - 14.6% |
GMC Yukon XL | 1796 | + 16.2% | 6632 | - 12.6% |
Nissan Armada | 1556 | + 26.0% | 7711 | + 5.0% |
Toyota Sequoia | 1043 | + 14.2% | 5156 | + 3.7% |
Related From GoodCarBadCar.net
Small SUV, Midsize SUV & Large SUV Sales In America - June 2012
Small, Midsize & Large SUV Sales In America - April 2012
Small, Midsize & Large SUV Sales In America - May 2011
Top 10 Best-Selling SUVs In America - May 2012
U.S. Auto Sales By Brand - May 2012

No comments:
Post a Comment