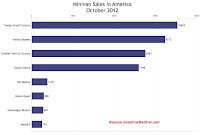
Americans registered 40,029 new minivans in October 2012. No minivan sold less frequently than the only mini-minivan on sale, Mazda's 5. Sales of the 5 are down 38% so far this year; September's 21% slide was only about half that bad. Year-to-date, the Kia Sedona - production of which has stalled - and Volkswagen Routan are also in decline.
The segment's three leaders are selling significantly better this year than they did in the first ten months of 2011. Overall, America's new vehicle market is up 14% in 2012. Chrysler's Town & Country and Dodge Grand Caravan, as well as Honda's second-ranked Odyssey, are all up at least 22%.
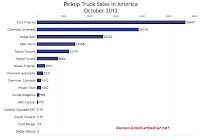
Americans registered 165,732 new pickup trucks in October 2012. Nameplates we now know to be done for, five of the 16 available last month, accounted for 1.6% of all pickup truck sales. The vast majority of trucks were full-sizers hailing from Detroit (perhaps assembled elsewhere). The Chevrolet Silverado, GMC Sierra, Ford F-Series, and Ram P/U were responsible for 81% of all October pickup volume.
For the Silverado and Sierra, October was the best U.S. sales month since last December. October was the fifth time this year that Ford sold more than 55,000 F-Series trucks in a single month, the fifth time Dodge sold more than 25,000 Rams, and the fourth time Toyota sold more than 12,000 Tacomas.
As will always be the case in the future, historic brand and corporate totals (monthly and yearly going back to 2002) are now available through the dropdown menu at GCBC's Sales Stats page, along with results for more than 260 currently sold vehicles. That's where you'll find out that Ford's missing 37,838 Ranger sales from last year.
You can study October 2012 and year-to-date sales figures, with year-over-year changes, in the tables visible after the jump. Click either of the two accompanying charts for a larger view.
Source: Manufacturers & ANDC
Related From GoodCarBadCar.net
Minivan Sales In America - November 2012
Pickup Truck Sales In America - November 2012
Truck Sales & Minivan Sales In America - September 2012
Truck Sales & Minivan Sales In America - October 2011
U.S. Auto Sales Brand Rankings - October 2012
Top 5 Best-Selling Trucks In America - October 2012
Top 30 Best-Selling Vehicles In America - October 2012
 |
| Minivan Sales Chart Click Either Chart For Larger View |
Americans registered 165,732 new pickup trucks in October 2012. Nameplates we now know to be done for, five of the 16 available last month, accounted for 1.6% of all pickup truck sales. The vast majority of trucks were full-sizers hailing from Detroit (perhaps assembled elsewhere). The Chevrolet Silverado, GMC Sierra, Ford F-Series, and Ram P/U were responsible for 81% of all October pickup volume.
 |
| Pickup Truck Sales Chart |
As will always be the case in the future, historic brand and corporate totals (monthly and yearly going back to 2002) are now available through the dropdown menu at GCBC's Sales Stats page, along with results for more than 260 currently sold vehicles. That's where you'll find out that Ford's missing 37,838 Ranger sales from last year.
You can study October 2012 and year-to-date sales figures, with year-over-year changes, in the tables visible after the jump. Click either of the two accompanying charts for a larger view.
Minivan | October 2012 | % Change | Year To Date | YTD % Change |
8281 | + 30.7% | 95,850 | + 22.5% | |
10,603 | + 49.3% | 118,730 | + 27.8% | |
9712 | - 6.7% | 107,536 | + 24.4% | |
1144 | - 25.8% | 15,598 | - 24.9% | |
761 | - 20.9% | 10,454 | - 38.4% | |
888 | + 38.5% | 15,402 | + 65.7% | |
7799 | - 11.0% | 94,986 | + 3.3% | |
841 | + 0.8% | 9087 | - 19.2% |
Truck | October 2012 | % Change | Year To Date | YTD % Change |
174 | + 6.7% | 1522 | - 3.5% | |
2331 | + 37.4% | 19,480 | + 24.2% | |
1612 | - 23.0% | 34,220 | + 31.2% | |
38,739 | + 5.7% | 336,939 | + 1.2% | |
Dodge Dakota | 2 | - 99.7% | 490 | - 95.7% |
25,222 | + 19.9% | 238,815 | + 20.0% | |
56,497 | + 7.65 | 520,230 | + 10.9% | |
74 | - 99.0% | 19,220 | - 66.3% | |
472 | - 39.3% | 8090 | - 3.8% | |
14,568 | + 9.0% | 126,749 | + 5.0% | |
996 | + 13.2% | 11,225 | + 52.6% | |
3051 | - 29.1% | 47,865 | + 14.6% | |
1582 | - 25.2% | 17,988 | + 3.0% | |
135 | - 33.5% | 1561 | - 13.4% | |
12,191 | + 19.8% | 115,063 | + 29.5% | |
8086 | + 24.5% | 83,058 | + 23.0% |
Related From GoodCarBadCar.net
Minivan Sales In America - November 2012
Pickup Truck Sales In America - November 2012
Truck Sales & Minivan Sales In America - September 2012
Truck Sales & Minivan Sales In America - October 2011
U.S. Auto Sales Brand Rankings - October 2012
Top 5 Best-Selling Trucks In America - October 2012
Top 30 Best-Selling Vehicles In America - October 2012

No comments:
Post a Comment