 |
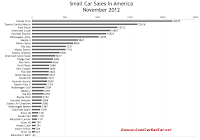
| Small Car Sales Chart Click Any Chart For Larger View |
As you saw last week, the Civic unseated the Camry as America's best-selling car in November 2012. Civic sales rose by 12,942 units compared with November 2011. Year-to-date, Civic sales are up by 84,101 units. It's America's fifth-best-selling vehicle overall and clearly the best-selling small car in the nation.
 |
| Midsize Car Sales Chart |
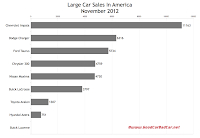
Chrysler sold 13,943 vehicles off their big car platform in November 2012. The Dodge Challenger, which will be seen in GCBC's sporty car sales post, accounted for 2868 of those sales. The Chrysler 300 and Dodge Charger were responsible for the bulk of the big car sales at Chrysler, 79% in all and 30% of passenger car sales at the Chrysler Group.
 |
| Large Car Sales Chart |
Click any of the three accompanying charts for a larger view. In those charts, cars are ranked by volume - they're listed alphabetically in the tables below.
Small Car | November 2012 | % Change | Year To Date | YTD % Change |
3574 | + 89,250% | 36,222 | + 905,450% | |
16,807 | + 27.0% | 216,528 | + 0.7% | |
5017 | + 10.8% | 75,321 | + 95.1% | |
1709 | ----- | 10,156 | ----- | |
32 | - 97.3% | 10,145 | - 69.8% | |
4489 | ----- | 19,198 | ----- | |
3603 | + 123% | 40,065 | + 130% | |
3688 | + 3.8% | 51,163 | - 21.2% | |
18,312 | + 56.0% | 223,318 | + 38.3% | |
30,075 | + 75.5% | 284,791 | + 41.9% | |
3315 | + 0.2% | 45,666 | - 15.6% | |
3260 | - 30.4% | 58,071 | + 15.5% | |
15,923 | + 28.3% | 183,010 | + 5.6% | |
2084 | - 17.9% | 32,886 | + 363% | |
4266 | + 3.1% | 71,405 | - 0.2% | |
2494 | + 15.5% | 37,932 | + 111% | |
7257 | + 5.7% | 108,601 | + 17.2% | |
2495 | + 211% | 16,348 | + 29.6% | |
9841 | + 43.2% | 113,064 | + 21.4% | |
3640 | + 9.0% | 40,879 | + 10.2% | |
42 | + 950% | 511 | + 12,675% | |
1101 | + 13.9% | 15,125 | - 17.5% | |
791 | + 290% | 7078 | - 49.6% | |
7176 | - 8.8% | 98,640 | - 7.2% | |
8826 | - 5.0% | 102,709 | + 14.4% | |
623 | ----- | 8303 | ----- | |
1341 | + 11.6% | 18,396 | + 18.1% | |
799 | + 3.4% | 10,079 | + 15.9% | |
704 | + 70.0% | 9013 | + 100% | |
5905 | + 318% | 74,294 | + 116% | |
2060 | ----- | 3987 | ----- | |
1176 | + 41.9% | 11,809 | + 5.5% | |
22,616 | + 40.3% | 266,268 | + 21.4% | |
3124 | ----- | 32,562 | ----- | |
2194 | - 60.8% | 28,591 | + 1.4% | |
1987 | + 20.0% | 25,992 | + 426% | |
2709 | + 14.0% | 38,031 | + 19.0% | |
14,259 | + 10.6% | 154,763 | - 5.0% |
Midsize Car | November 2012 | % Change | Year To Date | YTD % Change |
1101 | - 48.1% | 23,090 | - 37.7% | |
10,227 | - 0.4% | 199,321 | + 3.9% | |
1519 | + 33.4% | 20,828 | + 239% | |
7371 | - 8.6% | 116,396 | + 45.1% | |
7132 | + 26.4% | 89,508 | + 54.8% | |
4848 | ----- | 8999 | ----- | |
15,125 | - 24.0% | 221,980 | - 2.0% | |
26,248 | + 82.8% | 302,444 | + 38.8% | |
1907 | + 71.3% | 18,665 | + 11.9% | |
238 | - 68.2% | 5536 | - 62.7% | |
17,660 | + 12.7% | 209,779 | + 0.6% | |
12,715 | + 33.4% | 140,391 | + 17.2% | |
1204 | - 71.9% | 32,372 | - 0.8% | |
295 | - 53.4% | 12,962 | - 13.8% | |
20,305 | - 1.5% | 278,968 | + 14.8% | |
1539 | + 129% | 8330 | - 4.5% | |
3723 | + 28.7% | 42,910 | + 13.6% | |
10,124 | + 38.8% | 105,481 | + 15.9% | |
504 | + 20.0% | 5204 | - 18.0% | |
28,765 | + 22.7% | 373,479 | + 35.8% | |
16,505 | + 8.5% | 216,619 | + 81.3% | |
8925 | n/a | n/a | n/a | |
3124 | ----- | 32,562 | ----- | |
2690 | n/a | n/a | n/a | |
1766 | ----- | 11,368 | ----- | |
3660 | + 40.2% | 38,672 | + 8.1% | |
10,544 | + 75.2% | 102,561 | + 543% | |
2197 | + 29.4% | 19,450 | - 28.1% |
Large Car | November 2012 | % Change | Year To Date | YTD % Change |
3797 | - 5.3% | 53,002 | - 0.2% | |
----- | - 100% | 970 | - 95.1% | |
11,163 | + 2.9% | 159,710 | - 0.8% | |
4759 | + 17.0% | 63,572 | + 104% | |
6316 | + 23.9% | 74,725 | + 18.8% | |
5734 | + 17.0% | 67,471 | + 16.6% | |
751 | + 1195% | 7584 | + 404% | |
4730 | - 3.2% | 55,212 | + 2.9% | |
1307 | - 40.3% | 24,385 | - 5.1% |
Related From GoodCarBadCar.net
U.S. Small, Midsize & Large Car Sales: December & 2012 Year End
U.S. Small, Midsize & Large Car Sales - October 2012
U.S. Small, Midsize & Large Car Sales - November 2011
Top 20 Best-Selling Cars In America - November 2012
U.S. Auto Sales Brand Rankings - November 2012

No comments:
Post a Comment