 |
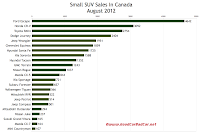
| Small SUV Sales Chart Click Any Chart For Larger View |
Enough about jumbo truck-based SUVs. The seven of them shown in the accompanying chart and table below accounted for just 0.35% of the overall new vehicle market. The Ford Escape, by itself, was responsible for 3.1% of all new vehicle sales in August 2012. Even a moderately successful crossover like the Toyota Highlander outsold the whole mainstream large SUV segment last month. 79 of the Highlanders sold were hybrids.
 |
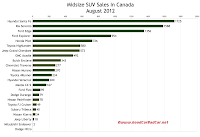
| Midsize SUV Sales Chart |
 |
| Large SUV Sales Chart |
Detailed August 2012 Canadian sales figures for dozens of SUVs and crossovers are visible after the jump.
 |
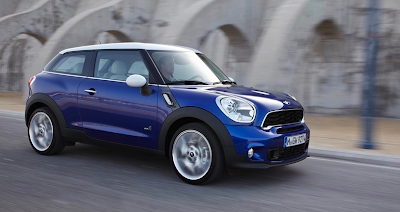
| What The Countryman Should Have Been? The 2014 Mini Paceman |
Small SUV | August 2012 | % Change | Year To Date | YTD % Change |
1859 | - 14.8% | 14,615 | - 9.3% | |
2404 | + 11.4% | 20,148 | - 5.6% | |
4642 | + 13.0% | 28,641 | - 9.4% | |
1243 | + 6.3% | 8203 | - 4.0% | |
3092 | + 35.4% | 23,495 | + 47.3% | |
----- | - 100% | 9 | - 94.6% | |
1725 | - 35.6% | 15,061 | - 17.6% | |
1352 | + 67.3% | 10,494 | + 0.5% | |
501 | - 9.1% | 4237 | - 9.7% | |
514 | - 28.3% | 4767 | - 17.2% | |
1951 | + 22.8% | 14,258 | + 21.1% | |
1588 | + 13.3% | 9530 | - 4.8% | |
721 | + 2.3% | 5800 | + 13.1% | |
844 | ----- | 7720 | ----- | |
164 | - 70.9% | 2704 | - 29.0% | |
----- | - 100% | 444 | - 81.9% | |
107 | + 61.7% | 1026 | + 16.5% | |
294 | - 39.4% | 3111 | - 13.6% | |
522 | + 25.8% | 4542 | - 5.6% | |
237 | - 35.1% | 2715 | + 2.8% | |
1037 | - 52.4% | 10,569 | + 16.3% | |
657 | - 4.6% | 4983 | - 7.1% | |
165 | + 41.0% | 1175 | - 5.1% | |
2754 | + 134% | 17,163 | + 22.5% | |
566 | + 59.4% | 3966 | + 4.8% |
Midsize SUV | August 2012 | % Change | Year To Date | YTD % Change |
343 | - 22.6% | 2266 | - 12.9% | |
277 | - 47.9% | 2264 | - 41.1% | |
79 | - 67.5% | 1862 | + 11.7% | |
----- | - 100% | 89 | - 77.8% | |
1356 | + 2.7% | 13,793 | + 28.1% | |
954 | + 22.3% | 7001 | + 11.4% | |
95 | - 55.2% | 2640 | + 19.1% | |
492 | - 13.2% | 3178 | - 19.1% | |
726 | + 37.8% | 3501 | + 23.8% | |
1725 | - 35.6% | 15,061 | - 17.6% | |
200 | + 55.0% | 1428 | + 49.4% | |
572 | - 14.6% | 6931 | + 4.6% | |
18 | - 81.6% | 847 | - 32.6% | |
1588 | + 13.3% | 9530 | - 4.8% | |
167 | + 41.5% | 841 | + 3.3% | |
2 | - 91.7% | 105 | - 36.4% | |
270 | - 55.6% | 3363 | + 7.7% | |
78 | - 62.1% | 1167 | - 16.6% | |
34 | - 39.3% | 630 | - 38.4% | |
40 | - 2.4% | 251 | - 14.0% | |
234 | + 8.8% | 1880 | + 9.7% | |
49 | - 25.8% | 465 | + 7.6% | |
580 | + 80.1% | 4013 | + 11.2% |
Large SUV | August 2012 | % Change | Year To Date | YTD % Change |
40 | - 23.1% | 614 | - 19.5% | |
70 | - 1.4% | 780 | + 18.9% | |
91 | - 25.4% | 1342 | + 12.3% | |
151 | + 93.6% | 741 | + 20.7% | |
108 | + 56.5% | 690 | + 11.1% | |
30 | - 47.4% | 414 | + 0.5% | |
33 | - 28.3% | 488 | - 0.2% |
Related From GoodCarBadCar.net
Small, Midsize & Large SUV Sales In Canada - September 2012
Small, Midsize & Large SUV Sales In Canada - July 2012
Small, Midsize & Large SUV Sales In Canada - August 2011
Top 20 Best-Selling SUVs In Canada - August 2012
Canada Auto Sales Brand Rankings - August 2012
Small, Midsize & Large Car Sales In Canada - August 2012
No comments:
Post a Comment