 |
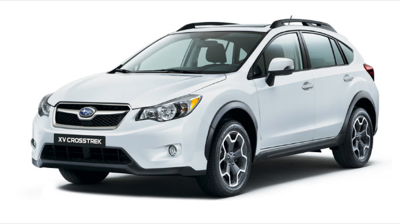
| The Subaru XV Crosstrek Had Its Best January Evaaahr! |
 |
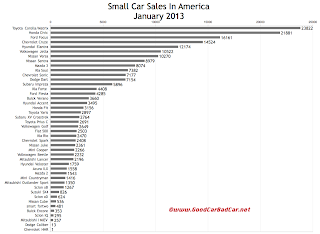
| Click Chart For Larger View |
Nissan's Versa led all other subcompacts by a wide margin; even the Accent/Rio tandem by 4305 units. And the Fiat 500 reported its 11th consecutive month of year-over-year increases. 73% of the Mini Coopers sold were traditional hardtops.
The accompanying chart, which ranks all these cars by January volume, can be clicked for a larger view. The tables below are sortable. Simply click the column header to arrange alphabetically, by volume, or by year-over-year change. And feel free to click any model name to be directed to its own Sales Stats page where historical monthly and yearly sales figures are located in one place.
Click Column Headers To Sort
Compact | January 2013 | % Change | Year To Date | YTD % Change |
|---|---|---|---|---|
1558 | ----- | 1558 | ----- | |
3660 | + 360% | 3660 | + 360% | |
14,524 | - 3.5% | 14,524 | - 3.5% | |
7154 | ----- | 7154 | ----- | |
16,161 | + 12.2% | 16,161 | + 12.2% | |
21,881 | - 0.01% | 21,881 | - 0.01% | |
12,174 | + 11.7% | 12,174 | + 11.7% | |
4408 | - 0.2% | 4408 | - 0.2% | |
8074 | - 12.2% | 8074 | - 12.2% | |
2196 | + 116% | 2196 | + 116% | |
8979 | + 27.1% | 8979 | + 27.1% | |
5896 | - 14.9% | 5896 | - 14.9% | |
826 | + 8.8% | 826 | + 8.8% | |
23,822 | + 32.4% | 23,822 | + 32.4% | |
2649 | - 0.04% | 2649 | - 0.04% | |
10,522 | - 4.0% | 10,522 | - 4.0% |
Subcompact | January 2013 | % Change | Year To Date | YTD % Change |
|---|---|---|---|---|
7177 | + 25.6% | 7177 | + 25.6% | |
4285 | + 22.4% | 4285 | + 22.4% | |
3156 | - 17.8% | 3156 | - 17.8% | |
3495 | - 19.5% | 3495 | - 19.5% | |
2470 | - 4.9% | 2470 | - 4.9% | |
1543 | - 49.1% | 1543 | - 49.1% | |
10,270 | + 9.0% | 10,270 | + 9.0% | |
2691 | ----- | 2691 | ----- | |
2897 | - 3.8% | 2897 | - 3.8% |
City Car | January 2013 | % Change | Year To Date | YTD % Change |
|---|---|---|---|---|
2408 | ----- | 2408 | ----- | |
257 | + 614% | 257 | + 614% | |
295 | - 21.1% | 295 | - 21.1% | |
481 | - 3.0% | 481 | - 3.0% |
Tall Boxes & Crossovers | January 2013 | % Change | Year To Date | YTD % Change |
|---|---|---|---|---|
353 | ----- | 353 | ----- | |
1 | - 75.0% | 1 | - 75.0% | |
13 | - 98.9% | 13 | - 98.9% | |
7382 | - 8.8% | 7382 | - 8.8% | |
1416 | + 12.5% | 1416 | + 12.5% | |
1350 | + 20.8% | 1350 | + 20.8% | |
536 | + 16.3% | 536 | + 16.3% | |
2361 | + 1.3% | 2361 | + 1.3% | |
1267 | + 5.6% | 1267 | + 5.6% | |
624 | - 4.3% | 624 | - 4.3% | |
2764 | ----- | 2764 | ----- |
Sporty Hatches | January 2013 | % Change | Year To Date | YTD % Change |
|---|---|---|---|---|
2503 | + 31.0% | 2503 | + 31.0% | |
1759 | + 3.9% | 1759 | + 3.9% | |
2266 | + 9.2% | 2266 | + 9.2% | |
2232 | + 59.3% | 2232 | + 59.3% |
* Indicates a car that is also shown in another GCBC segment breakdown
Related From GoodCarBadCar.net
Small Car Sales In America - February 2013
Small Car Sales In America - December & 2012 Year End
Small Car Sales In America - January 2012
Top 20 Best-Selling Cars In America - January 2013
U.S. Auto Sales Brand Rankings - January 2013
Midsize Car Sales In America - January 2013
No comments:
Post a Comment